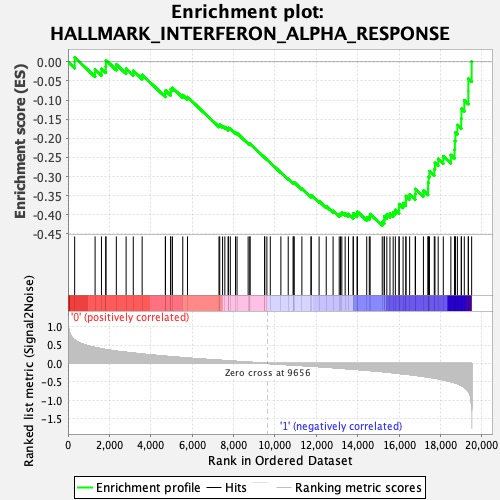
Profile of the Running ES Score & Positions of GeneSet Members on the Rank Ordered List
| Dataset | MPP.MPP_Pheno.cls#Group1_versus_Group2.MPP_Pheno.cls#Group1_versus_Group2_repos |
| Phenotype | MPP_Pheno.cls#Group1_versus_Group2_repos |
| Upregulated in class | 1 |
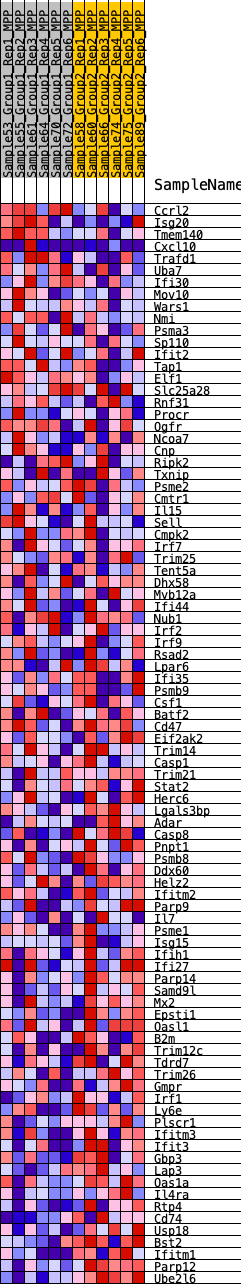
| GeneSet | HALLMARK_INTERFERON_ALPHA_RESPONSE |
| Enrichment Score (ES) | -0.42825136 |
| Normalized Enrichment Score (NES) | -1.3791345 |
| Nominal p-value | 0.16831683 |
| FDR q-value | 0.5252438 |
| FWER p-Value | 0.651 |
| SYMBOL | RANK IN GENE LIST | RANK METRIC SCORE | RUNNING ES | CORE ENRICHMENT | |
|---|---|---|---|---|---|
| 1 | Ccrl2 | 322 | 0.635 | 0.0116 | No |
| 2 | Isg20 | 1309 | 0.432 | -0.0200 | No |
| 3 | Tmem140 | 1617 | 0.398 | -0.0182 | No |
| 4 | Cxcl10 | 1826 | 0.376 | -0.0122 | No |
| 5 | Trafd1 | 1833 | 0.375 | 0.0042 | No |
| 6 | Uba7 | 2335 | 0.331 | -0.0070 | No |
| 7 | Ifi30 | 2808 | 0.301 | -0.0179 | No |
| 8 | Mov10 | 3154 | 0.280 | -0.0233 | No |
| 9 | Wars1 | 3583 | 0.252 | -0.0341 | No |
| 10 | Nmi | 4703 | 0.193 | -0.0832 | No |
| 11 | Psma3 | 4710 | 0.192 | -0.0749 | No |
| 12 | Sp110 | 4961 | 0.182 | -0.0797 | No |
| 13 | Ifit2 | 4962 | 0.182 | -0.0717 | No |
| 14 | Tap1 | 5046 | 0.179 | -0.0680 | No |
| 15 | Elf1 | 5546 | 0.155 | -0.0868 | No |
| 16 | Slc25a28 | 5773 | 0.145 | -0.0920 | No |
| 17 | Rnf31 | 7296 | 0.086 | -0.1666 | No |
| 18 | Procr | 7332 | 0.084 | -0.1647 | No |
| 19 | Ogfr | 7469 | 0.080 | -0.1681 | No |
| 20 | Ncoa7 | 7579 | 0.075 | -0.1704 | No |
| 21 | Cnp | 7741 | 0.069 | -0.1756 | No |
| 22 | Ripk2 | 7747 | 0.069 | -0.1728 | No |
| 23 | Txnip | 7842 | 0.065 | -0.1748 | No |
| 24 | Psme2 | 8094 | 0.056 | -0.1852 | No |
| 25 | Cmtr1 | 8168 | 0.053 | -0.1866 | No |
| 26 | Il15 | 8704 | 0.034 | -0.2126 | No |
| 27 | Sell | 8790 | 0.031 | -0.2156 | No |
| 28 | Cmpk2 | 8793 | 0.031 | -0.2143 | No |
| 29 | Irf7 | 9499 | 0.005 | -0.2504 | No |
| 30 | Trim25 | 9507 | 0.005 | -0.2505 | No |
| 31 | Tent5a | 9610 | 0.002 | -0.2557 | No |
| 32 | Dhx58 | 9775 | -0.004 | -0.2640 | No |
| 33 | Mvb12a | 10286 | -0.020 | -0.2893 | No |
| 34 | Ifi44 | 10641 | -0.033 | -0.3061 | No |
| 35 | Nub1 | 10875 | -0.041 | -0.3163 | No |
| 36 | Irf2 | 10910 | -0.042 | -0.3162 | No |
| 37 | Irf9 | 10927 | -0.043 | -0.3151 | No |
| 38 | Rsad2 | 11301 | -0.056 | -0.3318 | No |
| 39 | Lpar6 | 11739 | -0.072 | -0.3511 | No |
| 40 | Ifi35 | 11755 | -0.072 | -0.3487 | No |
| 41 | Psmb9 | 12133 | -0.086 | -0.3643 | No |
| 42 | Csf1 | 12478 | -0.100 | -0.3776 | No |
| 43 | Batf2 | 12809 | -0.113 | -0.3895 | No |
| 44 | Cd47 | 13105 | -0.126 | -0.3992 | No |
| 45 | Eif2ak2 | 13169 | -0.128 | -0.3967 | No |
| 46 | Trim14 | 13231 | -0.130 | -0.3941 | No |
| 47 | Casp1 | 13392 | -0.138 | -0.3962 | No |
| 48 | Trim21 | 13553 | -0.145 | -0.3980 | No |
| 49 | Stat2 | 13779 | -0.154 | -0.4028 | No |
| 50 | Herc6 | 13786 | -0.154 | -0.3962 | No |
| 51 | Lgals3bp | 13967 | -0.163 | -0.3983 | No |
| 52 | Adar | 13987 | -0.164 | -0.3920 | No |
| 53 | Casp8 | 14434 | -0.185 | -0.4067 | No |
| 54 | Pnpt1 | 14559 | -0.190 | -0.4047 | No |
| 55 | Psmb8 | 14599 | -0.192 | -0.3982 | No |
| 56 | Ddx60 | 15184 | -0.220 | -0.4185 | Yes |
| 57 | Helz2 | 15278 | -0.225 | -0.4133 | Yes |
| 58 | Ifitm2 | 15284 | -0.226 | -0.4035 | Yes |
| 59 | Parp9 | 15406 | -0.232 | -0.3994 | Yes |
| 60 | Il7 | 15557 | -0.241 | -0.3964 | Yes |
| 61 | Psme1 | 15712 | -0.252 | -0.3932 | Yes |
| 62 | Isg15 | 15817 | -0.259 | -0.3871 | Yes |
| 63 | Ifih1 | 15997 | -0.272 | -0.3842 | Yes |
| 64 | Ifi27 | 15999 | -0.272 | -0.3722 | Yes |
| 65 | Parp14 | 16191 | -0.283 | -0.3695 | Yes |
| 66 | Samd9l | 16327 | -0.290 | -0.3636 | Yes |
| 67 | Mx2 | 16329 | -0.290 | -0.3508 | Yes |
| 68 | Epsti1 | 16508 | -0.302 | -0.3465 | Yes |
| 69 | Oasl1 | 16778 | -0.319 | -0.3462 | Yes |
| 70 | B2m | 16789 | -0.320 | -0.3325 | Yes |
| 71 | Trim12c | 17174 | -0.350 | -0.3368 | Yes |
| 72 | Tdrd7 | 17397 | -0.369 | -0.3318 | Yes |
| 73 | Trim26 | 17400 | -0.369 | -0.3156 | Yes |
| 74 | Gmpr | 17425 | -0.371 | -0.3003 | Yes |
| 75 | Irf1 | 17466 | -0.375 | -0.2858 | Yes |
| 76 | Ly6e | 17699 | -0.395 | -0.2802 | Yes |
| 77 | Plscr1 | 17731 | -0.399 | -0.2641 | Yes |
| 78 | Ifitm3 | 17887 | -0.414 | -0.2537 | Yes |
| 79 | Ifit3 | 18134 | -0.445 | -0.2466 | Yes |
| 80 | Gbp3 | 18500 | -0.496 | -0.2434 | Yes |
| 81 | Lap3 | 18679 | -0.522 | -0.2294 | Yes |
| 82 | Oas1a | 18694 | -0.525 | -0.2069 | Yes |
| 83 | Il4ra | 18720 | -0.529 | -0.1847 | Yes |
| 84 | Rtp4 | 18815 | -0.546 | -0.1653 | Yes |
| 85 | Cd74 | 19001 | -0.597 | -0.1484 | Yes |
| 86 | Usp18 | 19011 | -0.600 | -0.1222 | Yes |
| 87 | Bst2 | 19149 | -0.647 | -0.1006 | Yes |
| 88 | Ifitm1 | 19343 | -0.752 | -0.0772 | Yes |
| 89 | Parp12 | 19344 | -0.752 | -0.0438 | Yes |
| 90 | Ube2l6 | 19504 | -1.181 | 0.0004 | Yes |