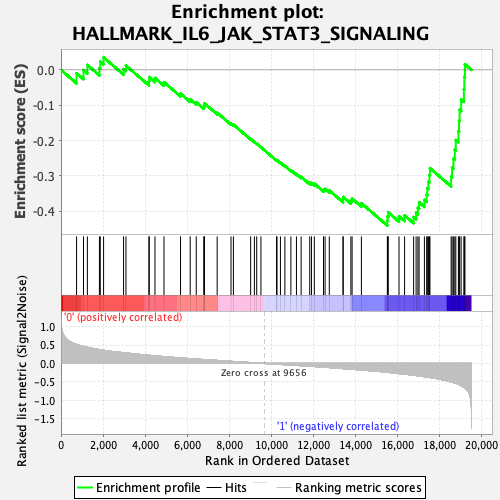
Profile of the Running ES Score & Positions of GeneSet Members on the Rank Ordered List
| Dataset | MPP.MPP_Pheno.cls#Group1_versus_Group2.MPP_Pheno.cls#Group1_versus_Group2_repos |
| Phenotype | MPP_Pheno.cls#Group1_versus_Group2_repos |
| Upregulated in class | 1 |
| GeneSet | HALLMARK_IL6_JAK_STAT3_SIGNALING |
| Enrichment Score (ES) | -0.44078967 |
| Normalized Enrichment Score (NES) | -1.4901472 |
| Nominal p-value | 0.08719852 |
| FDR q-value | 0.45728487 |
| FWER p-Value | 0.46 |
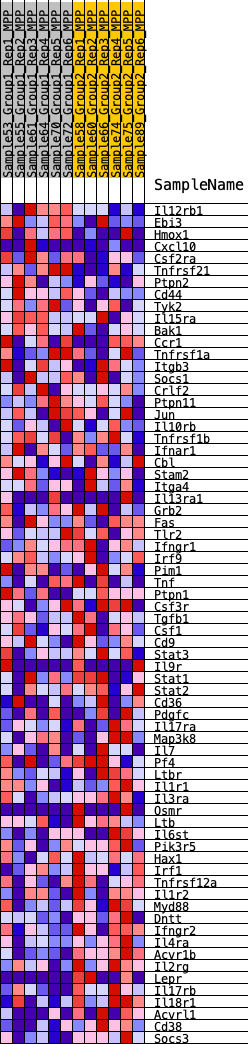
| SYMBOL | RANK IN GENE LIST | RANK METRIC SCORE | RUNNING ES | CORE ENRICHMENT | |
|---|---|---|---|---|---|
| 1 | Il12rb1 | 740 | 0.519 | -0.0095 | No |
| 2 | Ebi3 | 1069 | 0.465 | -0.0008 | No |
| 3 | Hmox1 | 1253 | 0.439 | 0.0139 | No |
| 4 | Cxcl10 | 1826 | 0.376 | 0.0052 | No |
| 5 | Csf2ra | 1867 | 0.372 | 0.0236 | No |
| 6 | Tnfrsf21 | 2024 | 0.359 | 0.0353 | No |
| 7 | Ptpn2 | 2974 | 0.290 | 0.0024 | No |
| 8 | Cd44 | 3088 | 0.283 | 0.0122 | No |
| 9 | Tyk2 | 4179 | 0.221 | -0.0317 | No |
| 10 | Il15ra | 4194 | 0.220 | -0.0203 | No |
| 11 | Bak1 | 4467 | 0.207 | -0.0229 | No |
| 12 | Ccr1 | 4895 | 0.185 | -0.0347 | No |
| 13 | Tnfrsf1a | 5682 | 0.148 | -0.0670 | No |
| 14 | Itgb3 | 6141 | 0.128 | -0.0835 | No |
| 15 | Socs1 | 6429 | 0.117 | -0.0918 | No |
| 16 | Crlf2 | 6788 | 0.104 | -0.1045 | No |
| 17 | Ptpn11 | 6813 | 0.103 | -0.1001 | No |
| 18 | Jun | 6818 | 0.103 | -0.0947 | No |
| 19 | Il10rb | 7423 | 0.082 | -0.1212 | No |
| 20 | Tnfrsf1b | 8081 | 0.057 | -0.1519 | No |
| 21 | Ifnar1 | 8195 | 0.052 | -0.1549 | No |
| 22 | Cbl | 9015 | 0.024 | -0.1957 | No |
| 23 | Stam2 | 9192 | 0.017 | -0.2038 | No |
| 24 | Itga4 | 9303 | 0.013 | -0.2088 | No |
| 25 | Il13ra1 | 9504 | 0.005 | -0.2188 | No |
| 26 | Grb2 | 10247 | -0.019 | -0.2559 | No |
| 27 | Fas | 10267 | -0.020 | -0.2558 | No |
| 28 | Tlr2 | 10431 | -0.026 | -0.2628 | No |
| 29 | Ifngr1 | 10642 | -0.033 | -0.2717 | No |
| 30 | Irf9 | 10927 | -0.043 | -0.2840 | No |
| 31 | Pim1 | 11192 | -0.051 | -0.2947 | No |
| 32 | Tnf | 11414 | -0.059 | -0.3028 | No |
| 33 | Ptpn1 | 11823 | -0.074 | -0.3198 | No |
| 34 | Csf3r | 11906 | -0.077 | -0.3197 | No |
| 35 | Tgfb1 | 12041 | -0.082 | -0.3221 | No |
| 36 | Csf1 | 12478 | -0.100 | -0.3390 | No |
| 37 | Cd9 | 12553 | -0.103 | -0.3371 | No |
| 38 | Stat3 | 12753 | -0.111 | -0.3413 | No |
| 39 | Il9r | 13406 | -0.139 | -0.3672 | No |
| 40 | Stat1 | 13413 | -0.139 | -0.3598 | No |
| 41 | Stat2 | 13779 | -0.154 | -0.3701 | No |
| 42 | Cd36 | 13837 | -0.156 | -0.3645 | No |
| 43 | Pdgfc | 14279 | -0.178 | -0.3774 | No |
| 44 | Il17ra | 15513 | -0.238 | -0.4277 | Yes |
| 45 | Map3k8 | 15521 | -0.239 | -0.4149 | Yes |
| 46 | Il7 | 15557 | -0.241 | -0.4034 | Yes |
| 47 | Pf4 | 16067 | -0.276 | -0.4144 | Yes |
| 48 | Ltbr | 16332 | -0.290 | -0.4120 | Yes |
| 49 | Il1r1 | 16762 | -0.318 | -0.4166 | Yes |
| 50 | Il3ra | 16880 | -0.328 | -0.4046 | Yes |
| 51 | Osmr | 16965 | -0.334 | -0.3905 | Yes |
| 52 | Ltb | 17021 | -0.337 | -0.3748 | Yes |
| 53 | Il6st | 17274 | -0.359 | -0.3681 | Yes |
| 54 | Pik3r5 | 17383 | -0.369 | -0.3533 | Yes |
| 55 | Hax1 | 17412 | -0.370 | -0.3344 | Yes |
| 56 | Irf1 | 17466 | -0.375 | -0.3166 | Yes |
| 57 | Tnfrsf12a | 17514 | -0.380 | -0.2981 | Yes |
| 58 | Il1r2 | 17537 | -0.382 | -0.2782 | Yes |
| 59 | Myd88 | 18545 | -0.501 | -0.3024 | Yes |
| 60 | Dntt | 18590 | -0.506 | -0.2768 | Yes |
| 61 | Ifngr2 | 18652 | -0.518 | -0.2515 | Yes |
| 62 | Il4ra | 18720 | -0.529 | -0.2258 | Yes |
| 63 | Acvr1b | 18767 | -0.537 | -0.1987 | Yes |
| 64 | Il2rg | 18890 | -0.565 | -0.1738 | Yes |
| 65 | Lepr | 18922 | -0.574 | -0.1438 | Yes |
| 66 | Il17rb | 18948 | -0.582 | -0.1131 | Yes |
| 67 | Il18r1 | 19020 | -0.603 | -0.0836 | Yes |
| 68 | Acvrl1 | 19152 | -0.649 | -0.0546 | Yes |
| 69 | Cd38 | 19172 | -0.659 | -0.0194 | Yes |
| 70 | Socs3 | 19201 | -0.670 | 0.0160 | Yes |