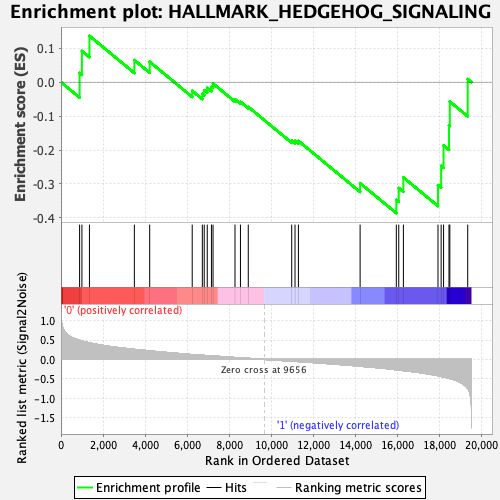
Profile of the Running ES Score & Positions of GeneSet Members on the Rank Ordered List
| Dataset | MPP.MPP_Pheno.cls#Group1_versus_Group2.MPP_Pheno.cls#Group1_versus_Group2_repos |
| Phenotype | MPP_Pheno.cls#Group1_versus_Group2_repos |
| Upregulated in class | 1 |
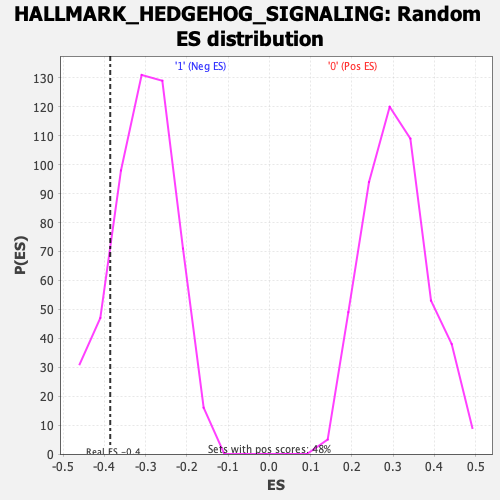
| GeneSet | HALLMARK_HEDGEHOG_SIGNALING |
| Enrichment Score (ES) | -0.38591874 |
| Normalized Enrichment Score (NES) | -1.2623204 |
| Nominal p-value | 0.1376673 |
| FDR q-value | 0.6414048 |
| FWER p-Value | 0.844 |
| SYMBOL | RANK IN GENE LIST | RANK METRIC SCORE | RUNNING ES | CORE ENRICHMENT | |
|---|---|---|---|---|---|
| 1 | Tle1 | 884 | 0.492 | 0.0272 | No |
| 2 | Ophn1 | 994 | 0.478 | 0.0920 | No |
| 3 | Vegfa | 1352 | 0.426 | 0.1365 | No |
| 4 | Adgrg1 | 3487 | 0.258 | 0.0651 | No |
| 5 | Celsr1 | 4216 | 0.219 | 0.0601 | No |
| 6 | Rasa1 | 6237 | 0.124 | -0.0253 | No |
| 7 | Rtn1 | 6718 | 0.106 | -0.0342 | No |
| 8 | Cdk5r1 | 6808 | 0.103 | -0.0236 | No |
| 9 | Nrcam | 6952 | 0.098 | -0.0165 | No |
| 10 | Ldb1 | 7151 | 0.091 | -0.0131 | No |
| 11 | Dpysl2 | 7227 | 0.088 | -0.0040 | No |
| 12 | Pml | 8271 | 0.049 | -0.0504 | No |
| 13 | Ptch1 | 8530 | 0.040 | -0.0577 | No |
| 14 | Myh9 | 8902 | 0.027 | -0.0727 | No |
| 15 | Nf1 | 10967 | -0.044 | -0.1722 | No |
| 16 | Nrp1 | 11124 | -0.049 | -0.1729 | No |
| 17 | Slit1 | 11285 | -0.055 | -0.1730 | No |
| 18 | Unc5c | 14218 | -0.175 | -0.2977 | No |
| 19 | Tle3 | 15939 | -0.267 | -0.3465 | Yes |
| 20 | Cdk6 | 16055 | -0.275 | -0.3118 | Yes |
| 21 | Nrp2 | 16275 | -0.287 | -0.2807 | Yes |
| 22 | Amot | 17920 | -0.418 | -0.3034 | Yes |
| 23 | Ache | 18070 | -0.437 | -0.2466 | Yes |
| 24 | Thy1 | 18185 | -0.450 | -0.1862 | Yes |
| 25 | L1cam | 18443 | -0.485 | -0.1278 | Yes |
| 26 | Ets2 | 18483 | -0.493 | -0.0571 | Yes |
| 27 | Vldlr | 19333 | -0.745 | 0.0092 | Yes |