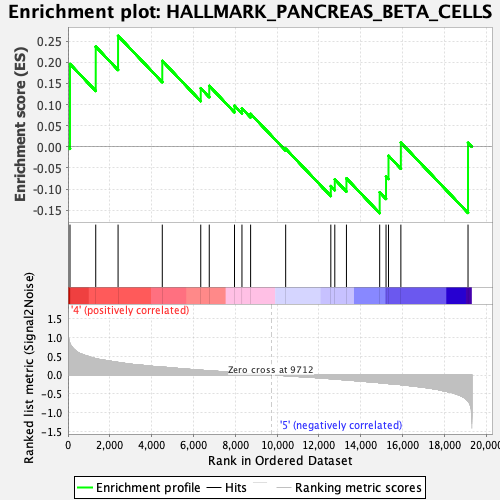
Profile of the Running ES Score & Positions of GeneSet Members on the Rank Ordered List
| Dataset | MEP.MEP.mega_Pheno.cls #Group6_versus_Group8.MEP.mega_Pheno.cls #Group6_versus_Group8_repos |
| Phenotype | MEP.mega_Pheno.cls#Group6_versus_Group8_repos |
| Upregulated in class | 4 |
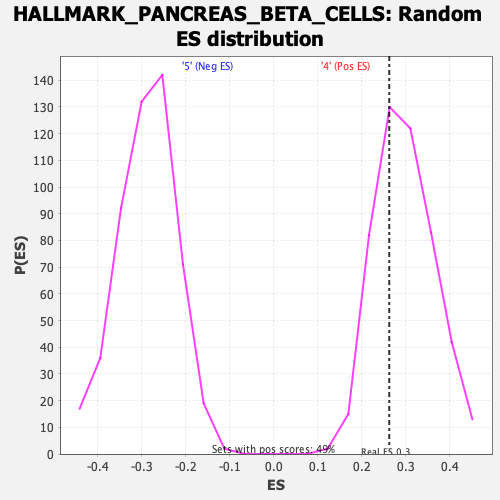
| GeneSet | HALLMARK_PANCREAS_BETA_CELLS |
| Enrichment Score (ES) | 0.2623745 |
| Normalized Enrichment Score (NES) | 0.87963986 |
| Nominal p-value | 0.67075664 |
| FDR q-value | 0.70592827 |
| FWER p-Value | 1.0 |
| SYMBOL | RANK IN GENE LIST | RANK METRIC SCORE | RUNNING ES | CORE ENRICHMENT | |
|---|---|---|---|---|---|
| 1 | Vdr | 95 | 0.828 | 0.1958 | Yes |
| 2 | Srprb | 1326 | 0.433 | 0.2369 | Yes |
| 3 | Pklr | 2394 | 0.333 | 0.2624 | Yes |
| 4 | Akt3 | 4508 | 0.207 | 0.2031 | No |
| 5 | Foxo1 | 6347 | 0.126 | 0.1385 | No |
| 6 | Stxbp1 | 6754 | 0.110 | 0.1440 | No |
| 7 | Mafb | 7961 | 0.064 | 0.0970 | No |
| 8 | Elp4 | 8317 | 0.050 | 0.0908 | No |
| 9 | Isl1 | 8731 | 0.035 | 0.0778 | No |
| 10 | Slc2a2 | 10407 | -0.018 | -0.0048 | No |
| 11 | Pcsk2 | 12566 | -0.097 | -0.0931 | No |
| 12 | Lmo2 | 12756 | -0.106 | -0.0773 | No |
| 13 | Gck | 13313 | -0.129 | -0.0747 | No |
| 14 | Srp14 | 14902 | -0.203 | -0.1078 | No |
| 15 | Sec11a | 15206 | -0.220 | -0.0701 | No |
| 16 | Pak3 | 15324 | -0.226 | -0.0214 | No |
| 17 | Dpp4 | 15915 | -0.255 | 0.0099 | No |
| 18 | Spcs1 | 19126 | -0.684 | 0.0094 | No |