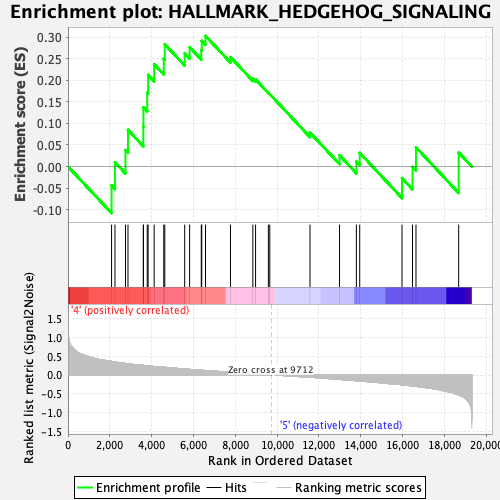
Profile of the Running ES Score & Positions of GeneSet Members on the Rank Ordered List
| Dataset | MEP.MEP.mega_Pheno.cls #Group6_versus_Group8.MEP.mega_Pheno.cls #Group6_versus_Group8_repos |
| Phenotype | MEP.mega_Pheno.cls#Group6_versus_Group8_repos |
| Upregulated in class | 4 |
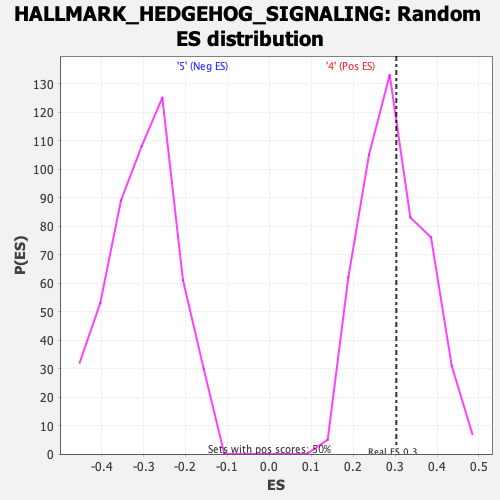
| GeneSet | HALLMARK_HEDGEHOG_SIGNALING |
| Enrichment Score (ES) | 0.30294508 |
| Normalized Enrichment Score (NES) | 1.0098205 |
| Nominal p-value | 0.43426296 |
| FDR q-value | 0.66544193 |
| FWER p-Value | 0.999 |
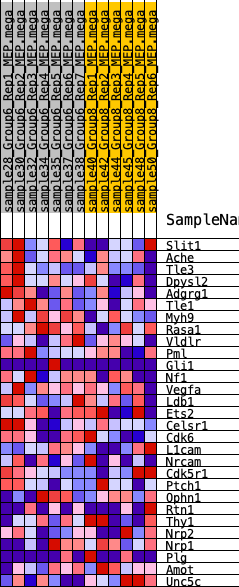
| SYMBOL | RANK IN GENE LIST | RANK METRIC SCORE | RUNNING ES | CORE ENRICHMENT | |
|---|---|---|---|---|---|
| 1 | Slit1 | 2083 | 0.360 | -0.0437 | Yes |
| 2 | Ache | 2246 | 0.348 | 0.0100 | Yes |
| 3 | Tle3 | 2749 | 0.304 | 0.0383 | Yes |
| 4 | Dpysl2 | 2868 | 0.295 | 0.0850 | Yes |
| 5 | Adgrg1 | 3601 | 0.253 | 0.0923 | Yes |
| 6 | Tle1 | 3606 | 0.253 | 0.1373 | Yes |
| 7 | Myh9 | 3788 | 0.244 | 0.1715 | Yes |
| 8 | Rasa1 | 3831 | 0.242 | 0.2124 | Yes |
| 9 | Vldlr | 4120 | 0.223 | 0.2373 | Yes |
| 10 | Pml | 4579 | 0.204 | 0.2499 | Yes |
| 11 | Gli1 | 4627 | 0.202 | 0.2835 | Yes |
| 12 | Nf1 | 5579 | 0.159 | 0.2626 | Yes |
| 13 | Vegfa | 5815 | 0.148 | 0.2768 | Yes |
| 14 | Ldb1 | 6372 | 0.125 | 0.2703 | Yes |
| 15 | Ets2 | 6395 | 0.124 | 0.2914 | Yes |
| 16 | Celsr1 | 6574 | 0.116 | 0.3029 | Yes |
| 17 | Cdk6 | 7768 | 0.072 | 0.2538 | No |
| 18 | L1cam | 8838 | 0.031 | 0.2039 | No |
| 19 | Nrcam | 8968 | 0.026 | 0.2019 | No |
| 20 | Cdk5r1 | 9580 | 0.004 | 0.1710 | No |
| 21 | Ptch1 | 9647 | 0.002 | 0.1680 | No |
| 22 | Ophn1 | 11570 | -0.059 | 0.0787 | No |
| 23 | Rtn1 | 12982 | -0.115 | 0.0262 | No |
| 24 | Thy1 | 13788 | -0.152 | 0.0115 | No |
| 25 | Nrp2 | 13948 | -0.159 | 0.0317 | No |
| 26 | Nrp1 | 15970 | -0.259 | -0.0269 | No |
| 27 | Plg | 16472 | -0.291 | -0.0009 | No |
| 28 | Amot | 16638 | -0.302 | 0.0445 | No |
| 29 | Unc5c | 18679 | -0.526 | 0.0326 | No |