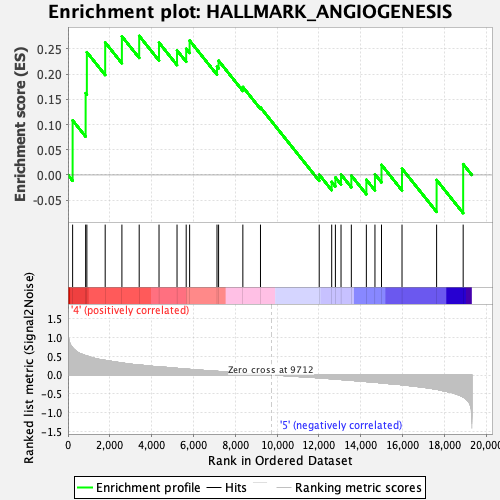
Profile of the Running ES Score & Positions of GeneSet Members on the Rank Ordered List
| Dataset | MEP.MEP.mega_Pheno.cls #Group6_versus_Group8.MEP.mega_Pheno.cls #Group6_versus_Group8_repos |
| Phenotype | MEP.mega_Pheno.cls#Group6_versus_Group8_repos |
| Upregulated in class | 4 |
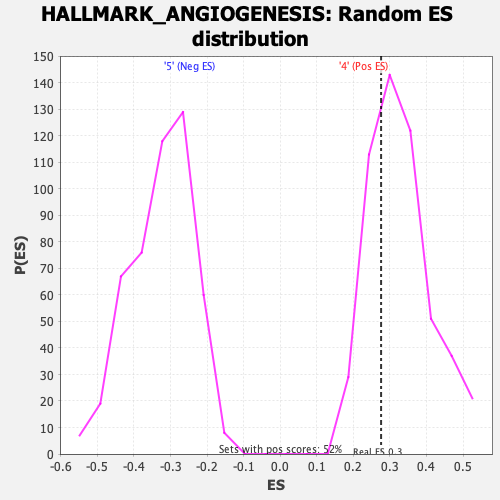
| GeneSet | HALLMARK_ANGIOGENESIS |
| Enrichment Score (ES) | 0.27585518 |
| Normalized Enrichment Score (NES) | 0.8486411 |
| Nominal p-value | 0.6957364 |
| FDR q-value | 0.7226164 |
| FWER p-Value | 1.0 |
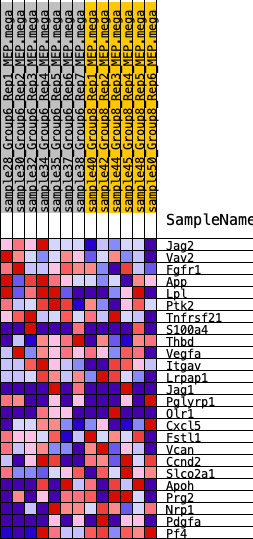
| SYMBOL | RANK IN GENE LIST | RANK METRIC SCORE | RUNNING ES | CORE ENRICHMENT | |
|---|---|---|---|---|---|
| 1 | Jag2 | 221 | 0.716 | 0.1082 | Yes |
| 2 | Vav2 | 843 | 0.516 | 0.1622 | Yes |
| 3 | Fgfr1 | 902 | 0.505 | 0.2435 | Yes |
| 4 | App | 1778 | 0.387 | 0.2628 | Yes |
| 5 | Lpl | 2577 | 0.320 | 0.2749 | Yes |
| 6 | Ptk2 | 3404 | 0.262 | 0.2759 | Yes |
| 7 | Tnfrsf21 | 4352 | 0.214 | 0.2624 | No |
| 8 | S100a4 | 5213 | 0.175 | 0.2471 | No |
| 9 | Thbd | 5651 | 0.155 | 0.2504 | No |
| 10 | Vegfa | 5815 | 0.148 | 0.2666 | No |
| 11 | Itgav | 7124 | 0.096 | 0.2149 | No |
| 12 | Lrpap1 | 7200 | 0.093 | 0.2266 | No |
| 13 | Jag1 | 8360 | 0.048 | 0.1746 | No |
| 14 | Pglyrp1 | 9203 | 0.018 | 0.1339 | No |
| 15 | Olr1 | 12011 | -0.074 | 0.0007 | No |
| 16 | Cxcl5 | 12608 | -0.099 | -0.0137 | No |
| 17 | Fstl1 | 12785 | -0.107 | -0.0050 | No |
| 18 | Vcan | 13054 | -0.119 | 0.0010 | No |
| 19 | Ccnd2 | 13547 | -0.140 | -0.0012 | No |
| 20 | Slco2a1 | 14265 | -0.173 | -0.0094 | No |
| 21 | Apoh | 14676 | -0.192 | 0.0014 | No |
| 22 | Prg2 | 14989 | -0.209 | 0.0201 | No |
| 23 | Nrp1 | 15970 | -0.259 | 0.0125 | No |
| 24 | Pdgfa | 17624 | -0.379 | -0.0099 | No |
| 25 | Pf4 | 18894 | -0.581 | 0.0214 | No |