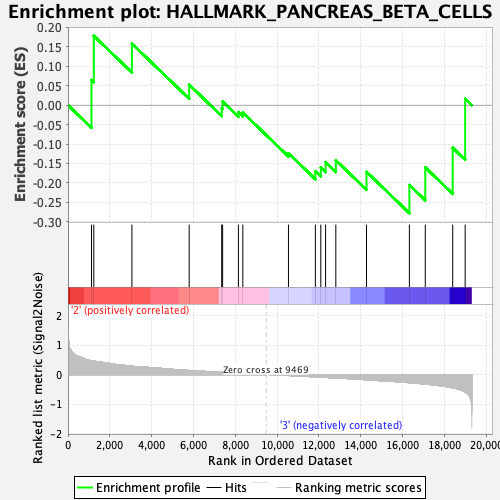
Profile of the Running ES Score & Positions of GeneSet Members on the Rank Ordered List
| Dataset | MEP.MEP.mega_Pheno.cls #Group3_versus_Group4.MEP.mega_Pheno.cls #Group3_versus_Group4_repos |
| Phenotype | MEP.mega_Pheno.cls#Group3_versus_Group4_repos |
| Upregulated in class | 3 |
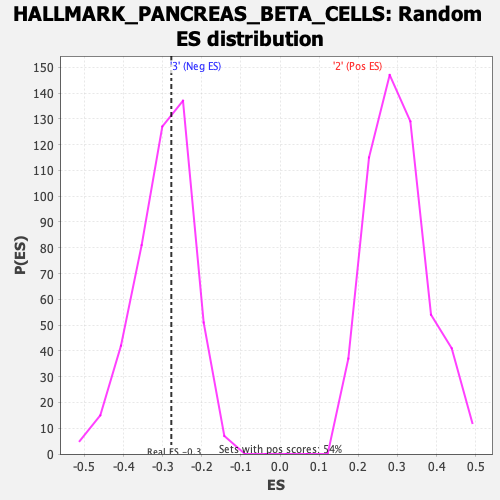
| GeneSet | HALLMARK_PANCREAS_BETA_CELLS |
| Enrichment Score (ES) | -0.27793917 |
| Normalized Enrichment Score (NES) | -0.9355597 |
| Nominal p-value | 0.5548387 |
| FDR q-value | 0.9774306 |
| FWER p-Value | 0.997 |
| SYMBOL | RANK IN GENE LIST | RANK METRIC SCORE | RUNNING ES | CORE ENRICHMENT | |
|---|---|---|---|---|---|
| 1 | Pak3 | 1123 | 0.466 | 0.0647 | No |
| 2 | Mafb | 1234 | 0.452 | 0.1784 | No |
| 3 | Gck | 3055 | 0.282 | 0.1585 | No |
| 4 | Sec11a | 5794 | 0.137 | 0.0526 | No |
| 5 | Slc2a2 | 7349 | 0.075 | -0.0080 | No |
| 6 | Lmo2 | 7393 | 0.074 | 0.0093 | No |
| 7 | Pklr | 8148 | 0.045 | -0.0180 | No |
| 8 | Foxo1 | 8359 | 0.037 | -0.0191 | No |
| 9 | Srprb | 10541 | -0.031 | -0.1239 | No |
| 10 | Elp4 | 11827 | -0.078 | -0.1699 | No |
| 11 | Spcs1 | 12087 | -0.087 | -0.1604 | No |
| 12 | Srp14 | 12316 | -0.096 | -0.1468 | No |
| 13 | Isl1 | 12805 | -0.115 | -0.1418 | No |
| 14 | Akt3 | 14272 | -0.175 | -0.1717 | No |
| 15 | Stxbp1 | 16322 | -0.274 | -0.2056 | Yes |
| 16 | Dpp4 | 17082 | -0.321 | -0.1602 | Yes |
| 17 | Vdr | 18394 | -0.449 | -0.1097 | Yes |
| 18 | Pcsk2 | 18989 | -0.595 | 0.0165 | Yes |