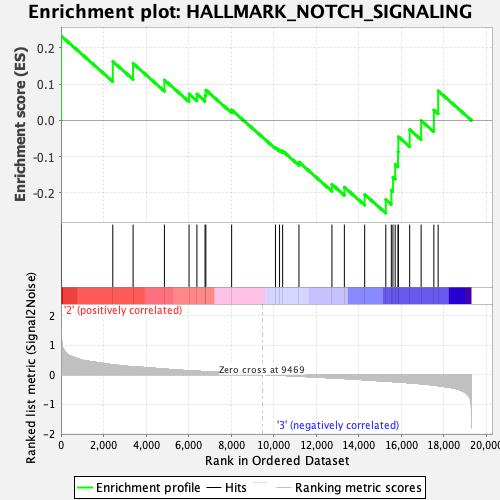
Profile of the Running ES Score & Positions of GeneSet Members on the Rank Ordered List
| Dataset | MEP.MEP.mega_Pheno.cls #Group3_versus_Group4.MEP.mega_Pheno.cls #Group3_versus_Group4_repos |
| Phenotype | MEP.mega_Pheno.cls#Group3_versus_Group4_repos |
| Upregulated in class | 3 |
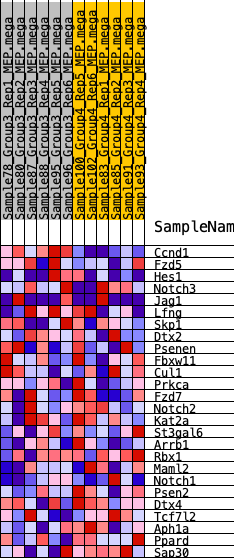
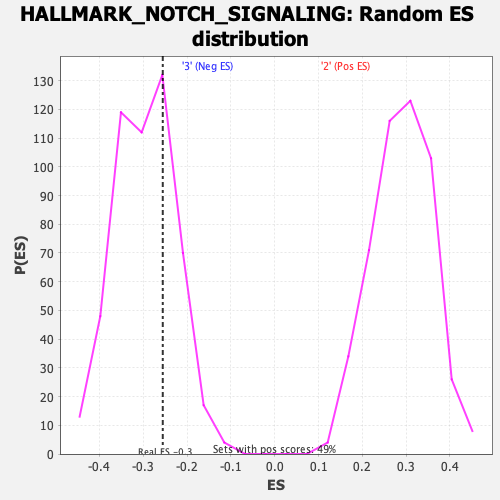
| GeneSet | HALLMARK_NOTCH_SIGNALING |
| Enrichment Score (ES) | -0.25552046 |
| Normalized Enrichment Score (NES) | -0.86557186 |
| Nominal p-value | 0.6815534 |
| FDR q-value | 0.86685973 |
| FWER p-Value | 1.0 |
| SYMBOL | RANK IN GENE LIST | RANK METRIC SCORE | RUNNING ES | CORE ENRICHMENT | |
|---|---|---|---|---|---|
| 1 | Ccnd1 | 6 | 1.387 | 0.2329 | Yes |
| 2 | Fzd5 | 2436 | 0.330 | 0.1624 | No |
| 3 | Hes1 | 3390 | 0.261 | 0.1569 | No |
| 4 | Notch3 | 4864 | 0.184 | 0.1114 | No |
| 5 | Jag1 | 6023 | 0.128 | 0.0729 | No |
| 6 | Lfng | 6392 | 0.112 | 0.0727 | No |
| 7 | Skp1 | 6775 | 0.098 | 0.0693 | No |
| 8 | Dtx2 | 6813 | 0.096 | 0.0835 | No |
| 9 | Psenen | 8026 | 0.049 | 0.0290 | No |
| 10 | Fbxw11 | 10087 | -0.016 | -0.0753 | No |
| 11 | Cul1 | 10280 | -0.022 | -0.0814 | No |
| 12 | Prkca | 10425 | -0.028 | -0.0842 | No |
| 13 | Fzd7 | 11192 | -0.055 | -0.1148 | No |
| 14 | Notch2 | 12744 | -0.113 | -0.1763 | No |
| 15 | Kat2a | 13328 | -0.134 | -0.1840 | No |
| 16 | St3gal6 | 14283 | -0.175 | -0.2040 | No |
| 17 | Arrb1 | 15277 | -0.221 | -0.2183 | No |
| 18 | Rbx1 | 15537 | -0.234 | -0.1925 | No |
| 19 | Maml2 | 15612 | -0.237 | -0.1564 | No |
| 20 | Notch1 | 15718 | -0.242 | -0.1212 | No |
| 21 | Psen2 | 15852 | -0.249 | -0.0862 | No |
| 22 | Dtx4 | 15867 | -0.251 | -0.0448 | No |
| 23 | Tcf7l2 | 16400 | -0.279 | -0.0254 | No |
| 24 | Aph1a | 16939 | -0.313 | -0.0006 | No |
| 25 | Ppard | 17537 | -0.358 | 0.0286 | No |
| 26 | Sap30 | 17739 | -0.375 | 0.0813 | No |