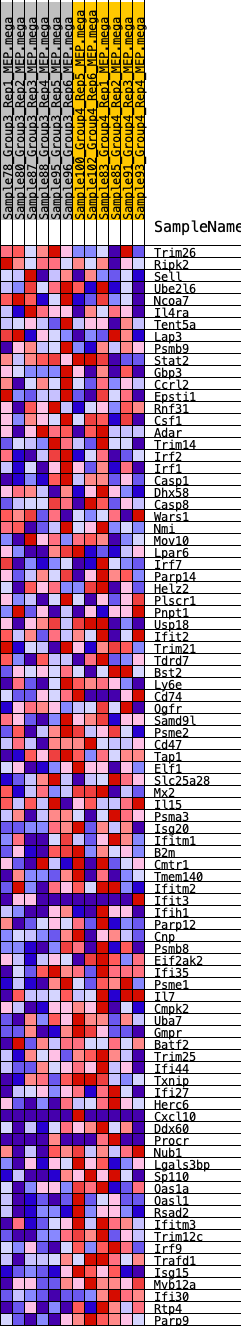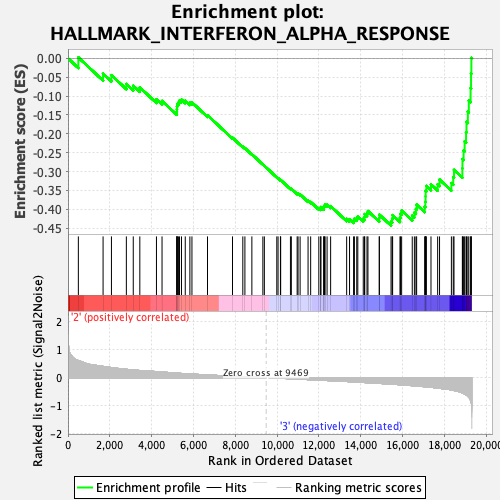
Profile of the Running ES Score & Positions of GeneSet Members on the Rank Ordered List
| Dataset | MEP.MEP.mega_Pheno.cls #Group3_versus_Group4.MEP.mega_Pheno.cls #Group3_versus_Group4_repos |
| Phenotype | MEP.mega_Pheno.cls#Group3_versus_Group4_repos |
| Upregulated in class | 3 |
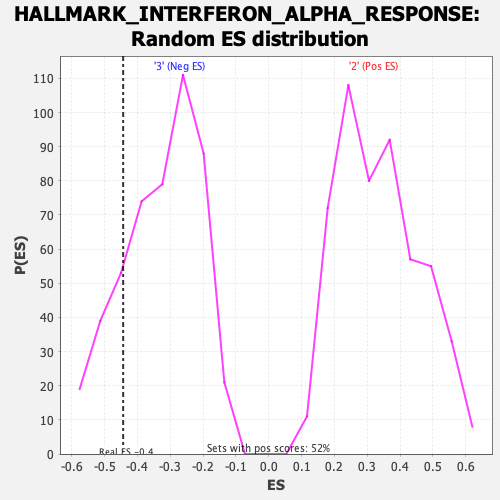
| GeneSet | HALLMARK_INTERFERON_ALPHA_RESPONSE |
| Enrichment Score (ES) | -0.44316056 |
| Normalized Enrichment Score (NES) | -1.3477782 |
| Nominal p-value | 0.18801653 |
| FDR q-value | 1.0 |
| FWER p-Value | 0.698 |
| SYMBOL | RANK IN GENE LIST | RANK METRIC SCORE | RUNNING ES | CORE ENRICHMENT | |
|---|---|---|---|---|---|
| 1 | Trim26 | 495 | 0.617 | 0.0024 | No |
| 2 | Ripk2 | 1677 | 0.406 | -0.0406 | No |
| 3 | Sell | 2077 | 0.363 | -0.0448 | No |
| 4 | Ube2l6 | 2790 | 0.303 | -0.0680 | No |
| 5 | Ncoa7 | 3120 | 0.277 | -0.0725 | No |
| 6 | Il4ra | 3434 | 0.258 | -0.0771 | No |
| 7 | Tent5a | 4229 | 0.218 | -0.1085 | No |
| 8 | Lap3 | 4496 | 0.205 | -0.1130 | No |
| 9 | Psmb9 | 5201 | 0.165 | -0.1421 | No |
| 10 | Stat2 | 5206 | 0.165 | -0.1348 | No |
| 11 | Gbp3 | 5212 | 0.164 | -0.1276 | No |
| 12 | Ccrl2 | 5227 | 0.163 | -0.1209 | No |
| 13 | Epsti1 | 5287 | 0.160 | -0.1166 | No |
| 14 | Rnf31 | 5332 | 0.158 | -0.1117 | No |
| 15 | Csf1 | 5426 | 0.153 | -0.1096 | No |
| 16 | Adar | 5606 | 0.145 | -0.1123 | No |
| 17 | Trim14 | 5827 | 0.135 | -0.1176 | No |
| 18 | Irf2 | 5926 | 0.130 | -0.1167 | No |
| 19 | Irf1 | 6670 | 0.101 | -0.1508 | No |
| 20 | Casp1 | 7865 | 0.056 | -0.2104 | No |
| 21 | Dhx58 | 8358 | 0.037 | -0.2343 | No |
| 22 | Casp8 | 8458 | 0.034 | -0.2379 | No |
| 23 | Wars1 | 8791 | 0.022 | -0.2542 | No |
| 24 | Nmi | 9317 | 0.005 | -0.2812 | No |
| 25 | Mov10 | 9388 | 0.003 | -0.2848 | No |
| 26 | Lpar6 | 9983 | -0.012 | -0.3151 | No |
| 27 | Irf7 | 10043 | -0.014 | -0.3175 | No |
| 28 | Parp14 | 10157 | -0.018 | -0.3226 | No |
| 29 | Helz2 | 10168 | -0.018 | -0.3223 | No |
| 30 | Plscr1 | 10635 | -0.035 | -0.3450 | No |
| 31 | Pnpt1 | 10678 | -0.036 | -0.3455 | No |
| 32 | Usp18 | 10956 | -0.046 | -0.3578 | No |
| 33 | Ifit2 | 10999 | -0.047 | -0.3578 | No |
| 34 | Trim21 | 11098 | -0.051 | -0.3606 | No |
| 35 | Tdrd7 | 11478 | -0.065 | -0.3774 | No |
| 36 | Bst2 | 11602 | -0.070 | -0.3806 | No |
| 37 | Ly6e | 11992 | -0.083 | -0.3970 | No |
| 38 | Cd74 | 12083 | -0.087 | -0.3977 | No |
| 39 | Ogfr | 12089 | -0.087 | -0.3940 | No |
| 40 | Samd9l | 12229 | -0.092 | -0.3970 | No |
| 41 | Psme2 | 12230 | -0.092 | -0.3928 | No |
| 42 | Cd47 | 12264 | -0.094 | -0.3903 | No |
| 43 | Tap1 | 12292 | -0.095 | -0.3874 | No |
| 44 | Elf1 | 12387 | -0.099 | -0.3877 | No |
| 45 | Slc25a28 | 12557 | -0.105 | -0.3917 | No |
| 46 | Mx2 | 13323 | -0.133 | -0.4255 | No |
| 47 | Il15 | 13461 | -0.140 | -0.4262 | No |
| 48 | Psma3 | 13654 | -0.147 | -0.4295 | No |
| 49 | Isg20 | 13694 | -0.149 | -0.4248 | No |
| 50 | Ifitm1 | 13806 | -0.154 | -0.4235 | No |
| 51 | B2m | 13856 | -0.156 | -0.4190 | No |
| 52 | Cmtr1 | 14117 | -0.168 | -0.4248 | No |
| 53 | Tmem140 | 14180 | -0.171 | -0.4203 | No |
| 54 | Ifitm2 | 14186 | -0.171 | -0.4127 | No |
| 55 | Ifit3 | 14296 | -0.176 | -0.4104 | No |
| 56 | Ifih1 | 14341 | -0.178 | -0.4046 | No |
| 57 | Parp12 | 14882 | -0.205 | -0.4233 | No |
| 58 | Cnp | 14887 | -0.205 | -0.4142 | No |
| 59 | Psmb8 | 15445 | -0.229 | -0.4327 | Yes |
| 60 | Eif2ak2 | 15499 | -0.231 | -0.4249 | Yes |
| 61 | Ifi35 | 15521 | -0.232 | -0.4154 | Yes |
| 62 | Psme1 | 15874 | -0.251 | -0.4223 | Yes |
| 63 | Il7 | 15895 | -0.252 | -0.4119 | Yes |
| 64 | Cmpk2 | 15952 | -0.255 | -0.4032 | Yes |
| 65 | Uba7 | 16459 | -0.283 | -0.4166 | Yes |
| 66 | Gmpr | 16561 | -0.288 | -0.4088 | Yes |
| 67 | Batf2 | 16635 | -0.292 | -0.3992 | Yes |
| 68 | Trim25 | 16669 | -0.294 | -0.3875 | Yes |
| 69 | Ifi44 | 17052 | -0.319 | -0.3929 | Yes |
| 70 | Txnip | 17087 | -0.321 | -0.3800 | Yes |
| 71 | Ifi27 | 17096 | -0.322 | -0.3657 | Yes |
| 72 | Herc6 | 17098 | -0.322 | -0.3511 | Yes |
| 73 | Cxcl10 | 17135 | -0.324 | -0.3382 | Yes |
| 74 | Ddx60 | 17355 | -0.342 | -0.3340 | Yes |
| 75 | Procr | 17674 | -0.368 | -0.3338 | Yes |
| 76 | Nub1 | 17764 | -0.378 | -0.3212 | Yes |
| 77 | Lgals3bp | 18330 | -0.439 | -0.3306 | Yes |
| 78 | Sp110 | 18419 | -0.452 | -0.3145 | Yes |
| 79 | Oas1a | 18455 | -0.457 | -0.2955 | Yes |
| 80 | Oasl1 | 18856 | -0.543 | -0.2916 | Yes |
| 81 | Rsad2 | 18860 | -0.544 | -0.2670 | Yes |
| 82 | Ifitm3 | 18914 | -0.560 | -0.2442 | Yes |
| 83 | Trim12c | 18964 | -0.584 | -0.2201 | Yes |
| 84 | Irf9 | 19033 | -0.613 | -0.1957 | Yes |
| 85 | Trafd1 | 19053 | -0.624 | -0.1683 | Yes |
| 86 | Isg15 | 19118 | -0.663 | -0.1414 | Yes |
| 87 | Mvb12a | 19164 | -0.696 | -0.1120 | Yes |
| 88 | Ifi30 | 19249 | -0.818 | -0.0791 | Yes |
| 89 | Rtp4 | 19271 | -0.877 | -0.0402 | Yes |
| 90 | Parp9 | 19286 | -0.922 | 0.0011 | Yes |