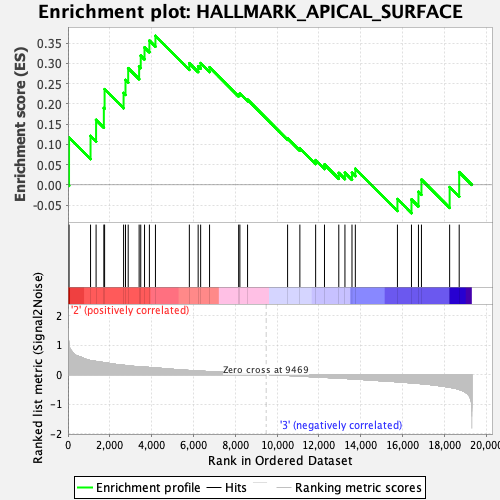
Profile of the Running ES Score & Positions of GeneSet Members on the Rank Ordered List
| Dataset | MEP.MEP.mega_Pheno.cls #Group3_versus_Group4.MEP.mega_Pheno.cls #Group3_versus_Group4_repos |
| Phenotype | MEP.mega_Pheno.cls#Group3_versus_Group4_repos |
| Upregulated in class | 2 |
| GeneSet | HALLMARK_APICAL_SURFACE |
| Enrichment Score (ES) | 0.36825445 |
| Normalized Enrichment Score (NES) | 1.2688923 |
| Nominal p-value | 0.16390042 |
| FDR q-value | 0.7041609 |
| FWER p-Value | 0.827 |
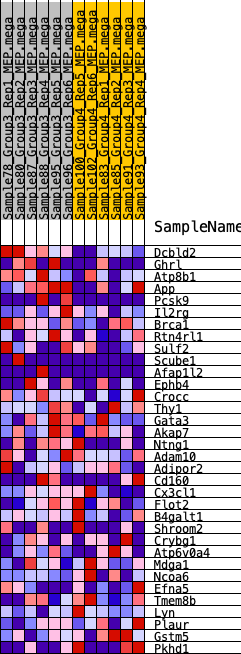
| SYMBOL | RANK IN GENE LIST | RANK METRIC SCORE | RUNNING ES | CORE ENRICHMENT | |
|---|---|---|---|---|---|
| 1 | Dcbld2 | 50 | 0.992 | 0.1170 | Yes |
| 2 | Ghrl | 1078 | 0.474 | 0.1209 | Yes |
| 3 | Atp8b1 | 1343 | 0.443 | 0.1606 | Yes |
| 4 | App | 1714 | 0.403 | 0.1900 | Yes |
| 5 | Pcsk9 | 1750 | 0.400 | 0.2364 | Yes |
| 6 | Il2rg | 2658 | 0.313 | 0.2271 | Yes |
| 7 | Brca1 | 2749 | 0.306 | 0.2593 | Yes |
| 8 | Rtn4rl1 | 2878 | 0.295 | 0.2883 | Yes |
| 9 | Sulf2 | 3401 | 0.260 | 0.2926 | Yes |
| 10 | Scube1 | 3478 | 0.255 | 0.3194 | Yes |
| 11 | Afap1l2 | 3659 | 0.246 | 0.3398 | Yes |
| 12 | Ephb4 | 3892 | 0.239 | 0.3565 | Yes |
| 13 | Crocc | 4181 | 0.221 | 0.3683 | Yes |
| 14 | Thy1 | 5802 | 0.136 | 0.3006 | No |
| 15 | Gata3 | 6223 | 0.119 | 0.2932 | No |
| 16 | Akap7 | 6342 | 0.115 | 0.3009 | No |
| 17 | Ntng1 | 6768 | 0.098 | 0.2906 | No |
| 18 | Adam10 | 8160 | 0.044 | 0.2238 | No |
| 19 | Adipor2 | 8218 | 0.042 | 0.2260 | No |
| 20 | Cd160 | 8585 | 0.029 | 0.2105 | No |
| 21 | Cx3cl1 | 10499 | -0.030 | 0.1149 | No |
| 22 | Flot2 | 11086 | -0.051 | 0.0906 | No |
| 23 | B4galt1 | 11840 | -0.079 | 0.0610 | No |
| 24 | Shroom2 | 12263 | -0.094 | 0.0504 | No |
| 25 | Crybg1 | 12947 | -0.120 | 0.0294 | No |
| 26 | Atp6v0a4 | 13241 | -0.130 | 0.0299 | No |
| 27 | Mdga1 | 13578 | -0.145 | 0.0299 | No |
| 28 | Ncoa6 | 13738 | -0.151 | 0.0399 | No |
| 29 | Efna5 | 15751 | -0.243 | -0.0352 | No |
| 30 | Tmem8b | 16422 | -0.281 | -0.0361 | No |
| 31 | Lyn | 16756 | -0.300 | -0.0172 | No |
| 32 | Plaur | 16899 | -0.311 | 0.0130 | No |
| 33 | Gstm5 | 18247 | -0.425 | -0.0056 | No |
| 34 | Pkhd1 | 18704 | -0.502 | 0.0313 | No |