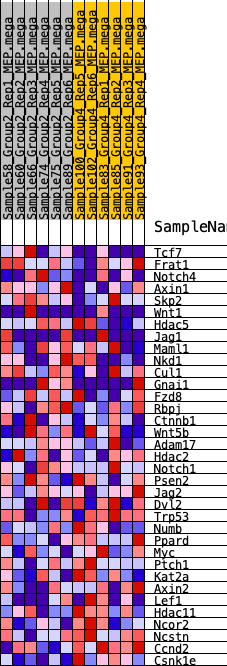
Profile of the Running ES Score & Positions of GeneSet Members on the Rank Ordered List
| Dataset | MEP.MEP.mega_Pheno.cls #Group2_versus_Group4.MEP.mega_Pheno.cls #Group2_versus_Group4_repos |
| Phenotype | MEP.mega_Pheno.cls#Group2_versus_Group4_repos |
| Upregulated in class | 3 |
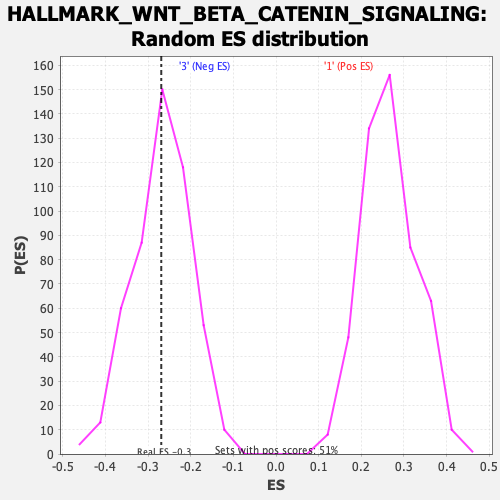
| GeneSet | HALLMARK_WNT_BETA_CATENIN_SIGNALING |
| Enrichment Score (ES) | -0.26912612 |
| Normalized Enrichment Score (NES) | -1.0035377 |
| Nominal p-value | 0.4848485 |
| FDR q-value | 0.8289527 |
| FWER p-Value | 0.981 |
| SYMBOL | RANK IN GENE LIST | RANK METRIC SCORE | RUNNING ES | CORE ENRICHMENT | |
|---|---|---|---|---|---|
| 1 | Tcf7 | 1069 | 0.483 | 0.0092 | No |
| 2 | Frat1 | 3326 | 0.283 | -0.0699 | No |
| 3 | Notch4 | 3394 | 0.277 | -0.0362 | No |
| 4 | Axin1 | 3621 | 0.263 | -0.0127 | No |
| 5 | Skp2 | 3983 | 0.243 | 0.0011 | No |
| 6 | Wnt1 | 4401 | 0.219 | 0.0088 | No |
| 7 | Hdac5 | 5984 | 0.143 | -0.0540 | No |
| 8 | Jag1 | 6338 | 0.126 | -0.0555 | No |
| 9 | Maml1 | 6385 | 0.123 | -0.0414 | No |
| 10 | Nkd1 | 6393 | 0.123 | -0.0252 | No |
| 11 | Cul1 | 6477 | 0.119 | -0.0136 | No |
| 12 | Gnai1 | 6485 | 0.119 | 0.0020 | No |
| 13 | Fzd8 | 6679 | 0.109 | 0.0066 | No |
| 14 | Rbpj | 6859 | 0.101 | 0.0108 | No |
| 15 | Ctnnb1 | 6890 | 0.099 | 0.0225 | No |
| 16 | Wnt5b | 7484 | 0.072 | 0.0014 | No |
| 17 | Adam17 | 7771 | 0.061 | -0.0053 | No |
| 18 | Hdac2 | 7786 | 0.060 | 0.0021 | No |
| 19 | Notch1 | 8681 | 0.020 | -0.0416 | No |
| 20 | Psen2 | 11168 | -0.077 | -0.1603 | No |
| 21 | Jag2 | 12915 | -0.151 | -0.2306 | No |
| 22 | Dvl2 | 13535 | -0.178 | -0.2388 | Yes |
| 23 | Trp53 | 13548 | -0.179 | -0.2154 | Yes |
| 24 | Numb | 13767 | -0.190 | -0.2013 | Yes |
| 25 | Ppard | 15076 | -0.255 | -0.2349 | Yes |
| 26 | Myc | 15146 | -0.258 | -0.2039 | Yes |
| 27 | Ptch1 | 15609 | -0.284 | -0.1898 | Yes |
| 28 | Kat2a | 15786 | -0.294 | -0.1596 | Yes |
| 29 | Axin2 | 15876 | -0.299 | -0.1241 | Yes |
| 30 | Lef1 | 15955 | -0.304 | -0.0873 | Yes |
| 31 | Hdac11 | 16452 | -0.337 | -0.0679 | Yes |
| 32 | Ncor2 | 16495 | -0.341 | -0.0244 | Yes |
| 33 | Ncstn | 16745 | -0.357 | 0.0106 | Yes |
| 34 | Ccnd2 | 17053 | -0.382 | 0.0458 | Yes |
| 35 | Csnk1e | 18378 | -0.530 | 0.0482 | Yes |