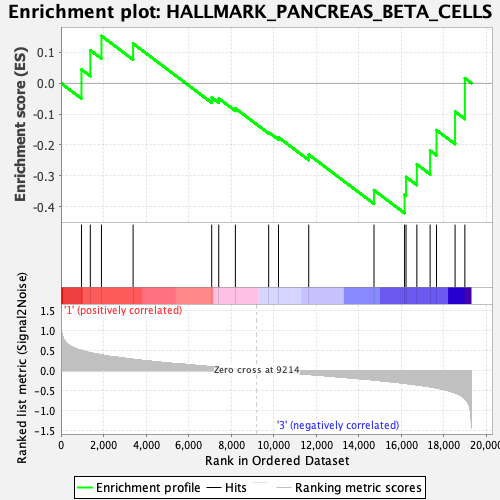
Profile of the Running ES Score & Positions of GeneSet Members on the Rank Ordered List
| Dataset | MEP.MEP.mega_Pheno.cls #Group2_versus_Group4.MEP.mega_Pheno.cls #Group2_versus_Group4_repos |
| Phenotype | MEP.mega_Pheno.cls#Group2_versus_Group4_repos |
| Upregulated in class | 3 |
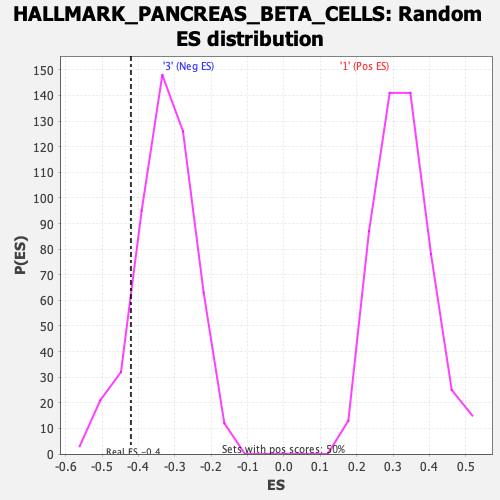
| GeneSet | HALLMARK_PANCREAS_BETA_CELLS |
| Enrichment Score (ES) | -0.4204988 |
| Normalized Enrichment Score (NES) | -1.2801781 |
| Nominal p-value | 0.11 |
| FDR q-value | 0.6520979 |
| FWER p-Value | 0.797 |
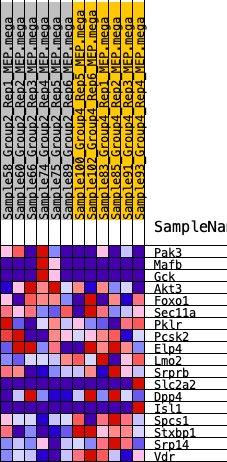
| SYMBOL | RANK IN GENE LIST | RANK METRIC SCORE | RUNNING ES | CORE ENRICHMENT | |
|---|---|---|---|---|---|
| 1 | Pak3 | 963 | 0.500 | 0.0444 | No |
| 2 | Mafb | 1378 | 0.444 | 0.1066 | No |
| 3 | Gck | 1903 | 0.390 | 0.1530 | No |
| 4 | Akt3 | 3391 | 0.277 | 0.1282 | No |
| 5 | Foxo1 | 7088 | 0.090 | -0.0464 | No |
| 6 | Sec11a | 7419 | 0.076 | -0.0492 | No |
| 7 | Pklr | 8202 | 0.044 | -0.0816 | No |
| 8 | Pcsk2 | 9768 | -0.020 | -0.1589 | No |
| 9 | Elp4 | 10230 | -0.040 | -0.1753 | No |
| 10 | Lmo2 | 11652 | -0.094 | -0.2311 | No |
| 11 | Srprb | 14722 | -0.235 | -0.3460 | No |
| 12 | Slc2a2 | 16160 | -0.317 | -0.3607 | Yes |
| 13 | Dpp4 | 16229 | -0.322 | -0.3034 | Yes |
| 14 | Isl1 | 16738 | -0.357 | -0.2624 | Yes |
| 15 | Spcs1 | 17362 | -0.405 | -0.2183 | Yes |
| 16 | Stxbp1 | 17663 | -0.435 | -0.1519 | Yes |
| 17 | Srp14 | 18536 | -0.556 | -0.0922 | Yes |
| 18 | Vdr | 18996 | -0.701 | 0.0161 | Yes |