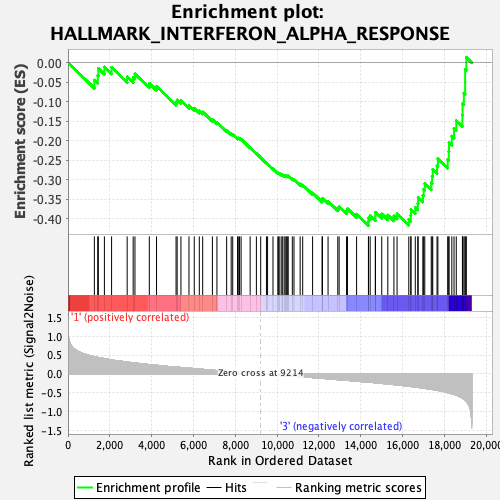
Profile of the Running ES Score & Positions of GeneSet Members on the Rank Ordered List
| Dataset | MEP.MEP.mega_Pheno.cls #Group2_versus_Group4.MEP.mega_Pheno.cls #Group2_versus_Group4_repos |
| Phenotype | MEP.mega_Pheno.cls#Group2_versus_Group4_repos |
| Upregulated in class | 3 |
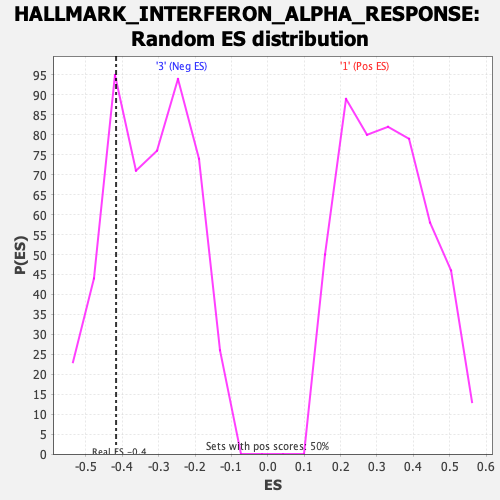
| GeneSet | HALLMARK_INTERFERON_ALPHA_RESPONSE |
| Enrichment Score (ES) | -0.41710997 |
| Normalized Enrichment Score (NES) | -1.2869576 |
| Nominal p-value | 0.21868788 |
| FDR q-value | 0.74909204 |
| FWER p-Value | 0.785 |
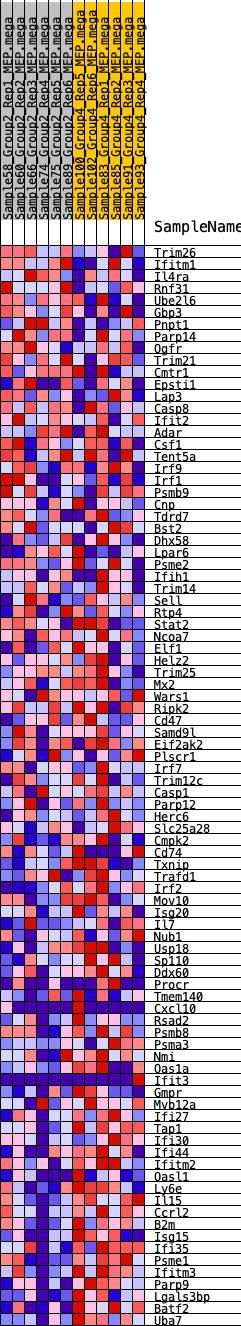
| SYMBOL | RANK IN GENE LIST | RANK METRIC SCORE | RUNNING ES | CORE ENRICHMENT | |
|---|---|---|---|---|---|
| 1 | Trim26 | 1260 | 0.459 | -0.0446 | No |
| 2 | Ifitm1 | 1421 | 0.438 | -0.0328 | No |
| 3 | Il4ra | 1451 | 0.435 | -0.0145 | No |
| 4 | Rnf31 | 1740 | 0.406 | -0.0109 | No |
| 5 | Ube2l6 | 2084 | 0.372 | -0.0117 | No |
| 6 | Gbp3 | 2829 | 0.313 | -0.0361 | No |
| 7 | Pnpt1 | 3116 | 0.296 | -0.0374 | No |
| 8 | Parp14 | 3201 | 0.291 | -0.0285 | No |
| 9 | Ogfr | 3888 | 0.247 | -0.0529 | No |
| 10 | Trim21 | 4233 | 0.229 | -0.0603 | No |
| 11 | Cmtr1 | 5166 | 0.178 | -0.1007 | No |
| 12 | Epsti1 | 5219 | 0.176 | -0.0953 | No |
| 13 | Lap3 | 5400 | 0.170 | -0.0969 | No |
| 14 | Casp8 | 5784 | 0.154 | -0.1098 | No |
| 15 | Ifit2 | 6037 | 0.140 | -0.1165 | No |
| 16 | Adar | 6278 | 0.129 | -0.1231 | No |
| 17 | Csf1 | 6439 | 0.121 | -0.1259 | No |
| 18 | Tent5a | 6904 | 0.098 | -0.1456 | No |
| 19 | Irf9 | 7121 | 0.089 | -0.1527 | No |
| 20 | Irf1 | 7585 | 0.069 | -0.1737 | No |
| 21 | Psmb9 | 7802 | 0.060 | -0.1822 | No |
| 22 | Cnp | 7875 | 0.057 | -0.1833 | No |
| 23 | Tdrd7 | 8107 | 0.048 | -0.1932 | No |
| 24 | Bst2 | 8140 | 0.046 | -0.1927 | No |
| 25 | Dhx58 | 8201 | 0.044 | -0.1939 | No |
| 26 | Lpar6 | 8276 | 0.040 | -0.1959 | No |
| 27 | Psme2 | 8709 | 0.019 | -0.2175 | No |
| 28 | Ifih1 | 9007 | 0.009 | -0.2325 | No |
| 29 | Trim14 | 9213 | 0.000 | -0.2432 | No |
| 30 | Sell | 9488 | -0.008 | -0.2571 | No |
| 31 | Rtp4 | 9542 | -0.011 | -0.2594 | No |
| 32 | Stat2 | 9801 | -0.021 | -0.2718 | No |
| 33 | Ncoa7 | 10032 | -0.031 | -0.2823 | No |
| 34 | Elf1 | 10071 | -0.032 | -0.2828 | No |
| 35 | Helz2 | 10130 | -0.035 | -0.2842 | No |
| 36 | Trim25 | 10232 | -0.040 | -0.2877 | No |
| 37 | Mx2 | 10238 | -0.040 | -0.2861 | No |
| 38 | Wars1 | 10332 | -0.044 | -0.2889 | No |
| 39 | Ripk2 | 10384 | -0.046 | -0.2895 | No |
| 40 | Cd47 | 10439 | -0.049 | -0.2900 | No |
| 41 | Samd9l | 10486 | -0.050 | -0.2901 | No |
| 42 | Eif2ak2 | 10529 | -0.052 | -0.2900 | No |
| 43 | Plscr1 | 10725 | -0.059 | -0.2974 | No |
| 44 | Irf7 | 10805 | -0.062 | -0.2987 | No |
| 45 | Trim12c | 11099 | -0.074 | -0.3106 | No |
| 46 | Casp1 | 11221 | -0.079 | -0.3133 | No |
| 47 | Parp12 | 11695 | -0.097 | -0.3334 | No |
| 48 | Herc6 | 12147 | -0.116 | -0.3516 | No |
| 49 | Slc25a28 | 12168 | -0.117 | -0.3473 | No |
| 50 | Cmpk2 | 12434 | -0.128 | -0.3552 | No |
| 51 | Cd74 | 12899 | -0.150 | -0.3725 | No |
| 52 | Txnip | 12963 | -0.154 | -0.3687 | No |
| 53 | Trafd1 | 13318 | -0.169 | -0.3794 | No |
| 54 | Irf2 | 13362 | -0.171 | -0.3738 | No |
| 55 | Mov10 | 13798 | -0.191 | -0.3877 | No |
| 56 | Isg20 | 14364 | -0.217 | -0.4072 | Yes |
| 57 | Il7 | 14369 | -0.217 | -0.3975 | Yes |
| 58 | Nub1 | 14448 | -0.220 | -0.3914 | Yes |
| 59 | Usp18 | 14696 | -0.233 | -0.3936 | Yes |
| 60 | Sp110 | 14697 | -0.233 | -0.3829 | Yes |
| 61 | Ddx60 | 15001 | -0.251 | -0.3872 | Yes |
| 62 | Procr | 15291 | -0.266 | -0.3901 | Yes |
| 63 | Tmem140 | 15583 | -0.283 | -0.3923 | Yes |
| 64 | Cxcl10 | 15733 | -0.290 | -0.3868 | Yes |
| 65 | Rsad2 | 16294 | -0.326 | -0.4010 | Yes |
| 66 | Psmb8 | 16390 | -0.332 | -0.3908 | Yes |
| 67 | Psma3 | 16399 | -0.332 | -0.3760 | Yes |
| 68 | Nmi | 16604 | -0.349 | -0.3707 | Yes |
| 69 | Oas1a | 16725 | -0.356 | -0.3606 | Yes |
| 70 | Ifit3 | 16740 | -0.357 | -0.3450 | Yes |
| 71 | Gmpr | 16966 | -0.374 | -0.3396 | Yes |
| 72 | Mvb12a | 17004 | -0.378 | -0.3243 | Yes |
| 73 | Ifi27 | 17058 | -0.382 | -0.3096 | Yes |
| 74 | Tap1 | 17367 | -0.406 | -0.3070 | Yes |
| 75 | Ifi30 | 17409 | -0.410 | -0.2904 | Yes |
| 76 | Ifi44 | 17439 | -0.412 | -0.2730 | Yes |
| 77 | Ifitm2 | 17644 | -0.432 | -0.2639 | Yes |
| 78 | Oasl1 | 17685 | -0.438 | -0.2460 | Yes |
| 79 | Ly6e | 18153 | -0.494 | -0.2477 | Yes |
| 80 | Il15 | 18205 | -0.502 | -0.2274 | Yes |
| 81 | Ccrl2 | 18217 | -0.504 | -0.2049 | Yes |
| 82 | B2m | 18351 | -0.525 | -0.1878 | Yes |
| 83 | Isg15 | 18457 | -0.543 | -0.1684 | Yes |
| 84 | Ifi35 | 18564 | -0.562 | -0.1483 | Yes |
| 85 | Psme1 | 18858 | -0.642 | -0.1342 | Yes |
| 86 | Ifitm3 | 18864 | -0.644 | -0.1050 | Yes |
| 87 | Parp9 | 18927 | -0.667 | -0.0777 | Yes |
| 88 | Lgals3bp | 18988 | -0.697 | -0.0490 | Yes |
| 89 | Batf2 | 18989 | -0.698 | -0.0171 | Yes |
| 90 | Uba7 | 19046 | -0.734 | 0.0136 | Yes |