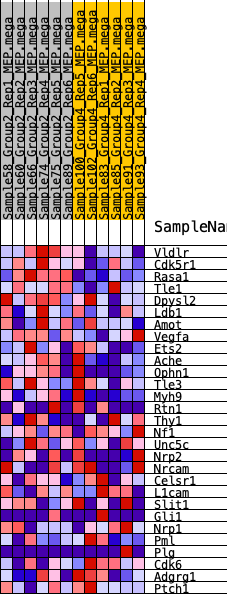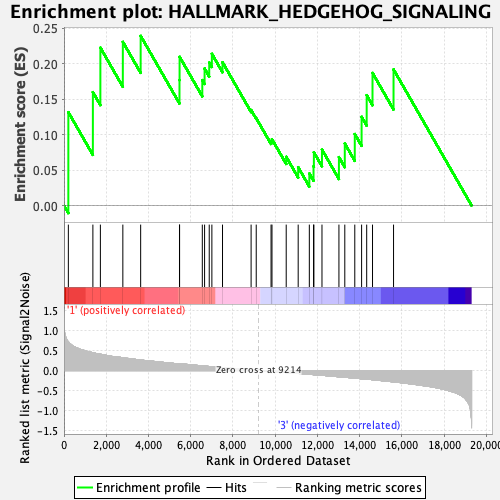
Profile of the Running ES Score & Positions of GeneSet Members on the Rank Ordered List
| Dataset | MEP.MEP.mega_Pheno.cls #Group2_versus_Group4.MEP.mega_Pheno.cls #Group2_versus_Group4_repos |
| Phenotype | MEP.mega_Pheno.cls#Group2_versus_Group4_repos |
| Upregulated in class | 1 |
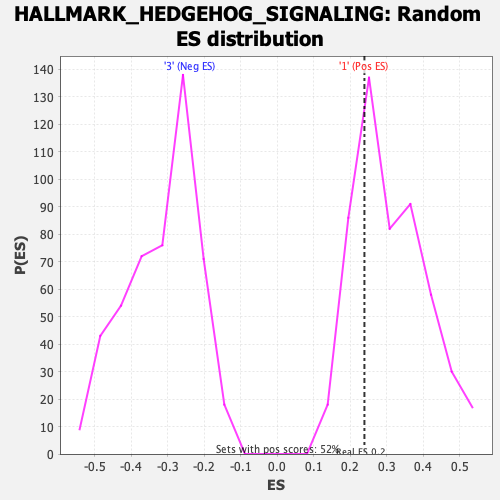
| GeneSet | HALLMARK_HEDGEHOG_SIGNALING |
| Enrichment Score (ES) | 0.23907478 |
| Normalized Enrichment Score (NES) | 0.77232695 |
| Nominal p-value | 0.74181116 |
| FDR q-value | 0.980539 |
| FWER p-Value | 1.0 |
| SYMBOL | RANK IN GENE LIST | RANK METRIC SCORE | RUNNING ES | CORE ENRICHMENT | |
|---|---|---|---|---|---|
| 1 | Vldlr | 206 | 0.715 | 0.1315 | Yes |
| 2 | Cdk5r1 | 1368 | 0.445 | 0.1598 | Yes |
| 3 | Rasa1 | 1723 | 0.407 | 0.2225 | Yes |
| 4 | Tle1 | 2787 | 0.318 | 0.2306 | Yes |
| 5 | Dpysl2 | 3631 | 0.262 | 0.2391 | Yes |
| 6 | Ldb1 | 5470 | 0.166 | 0.1768 | No |
| 7 | Amot | 5475 | 0.166 | 0.2096 | No |
| 8 | Vegfa | 6551 | 0.116 | 0.1768 | No |
| 9 | Ets2 | 6659 | 0.110 | 0.1931 | No |
| 10 | Ache | 6879 | 0.100 | 0.2016 | No |
| 11 | Ophn1 | 7004 | 0.094 | 0.2138 | No |
| 12 | Tle3 | 7508 | 0.071 | 0.2019 | No |
| 13 | Myh9 | 8862 | 0.015 | 0.1346 | No |
| 14 | Rtn1 | 9105 | 0.005 | 0.1230 | No |
| 15 | Thy1 | 9807 | -0.022 | 0.0910 | No |
| 16 | Nf1 | 9851 | -0.023 | 0.0934 | No |
| 17 | Unc5c | 10525 | -0.051 | 0.0687 | No |
| 18 | Nrp2 | 11092 | -0.074 | 0.0540 | No |
| 19 | Nrcam | 11620 | -0.093 | 0.0452 | No |
| 20 | Celsr1 | 11819 | -0.103 | 0.0553 | No |
| 21 | L1cam | 11836 | -0.103 | 0.0750 | No |
| 22 | Slit1 | 12219 | -0.119 | 0.0789 | No |
| 23 | Gli1 | 13022 | -0.156 | 0.0683 | No |
| 24 | Nrp1 | 13300 | -0.168 | 0.0874 | No |
| 25 | Pml | 13773 | -0.191 | 0.1008 | No |
| 26 | Plg | 14096 | -0.206 | 0.1250 | No |
| 27 | Cdk6 | 14337 | -0.216 | 0.1555 | No |
| 28 | Adgrg1 | 14613 | -0.229 | 0.1869 | No |
| 29 | Ptch1 | 15609 | -0.284 | 0.1918 | No |