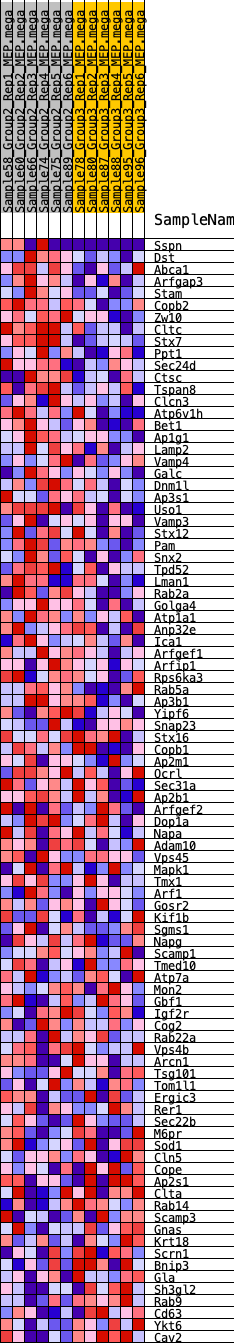
Profile of the Running ES Score & Positions of GeneSet Members on the Rank Ordered List
| Dataset | MEP.MEP.mega_Pheno.cls #Group2_versus_Group3.MEP.mega_Pheno.cls #Group2_versus_Group3_repos |
| Phenotype | MEP.mega_Pheno.cls#Group2_versus_Group3_repos |
| Upregulated in class | 1 |
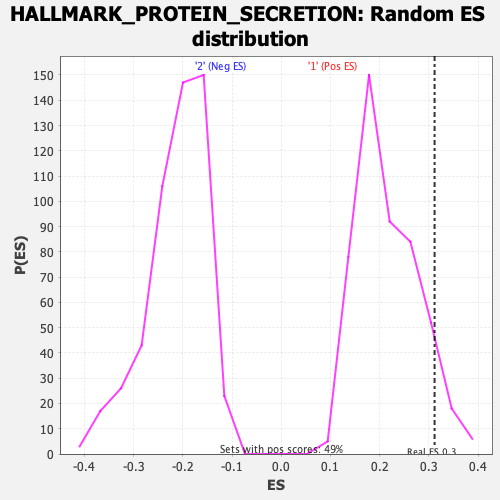
| GeneSet | HALLMARK_PROTEIN_SECRETION |
| Enrichment Score (ES) | 0.31172535 |
| Normalized Enrichment Score (NES) | 1.4474313 |
| Nominal p-value | 0.072164945 |
| FDR q-value | 0.9912416 |
| FWER p-Value | 0.598 |
| SYMBOL | RANK IN GENE LIST | RANK METRIC SCORE | RUNNING ES | CORE ENRICHMENT | |
|---|---|---|---|---|---|
| 1 | Sspn | 419 | 0.559 | 0.0082 | Yes |
| 2 | Dst | 492 | 0.537 | 0.0333 | Yes |
| 3 | Abca1 | 540 | 0.526 | 0.0591 | Yes |
| 4 | Arfgap3 | 718 | 0.491 | 0.0763 | Yes |
| 5 | Stam | 737 | 0.485 | 0.1013 | Yes |
| 6 | Copb2 | 1034 | 0.433 | 0.1092 | Yes |
| 7 | Zw10 | 1198 | 0.413 | 0.1229 | Yes |
| 8 | Cltc | 1237 | 0.410 | 0.1429 | Yes |
| 9 | Stx7 | 1613 | 0.375 | 0.1435 | Yes |
| 10 | Ppt1 | 1804 | 0.356 | 0.1527 | Yes |
| 11 | Sec24d | 1939 | 0.346 | 0.1643 | Yes |
| 12 | Ctsc | 1955 | 0.345 | 0.1821 | Yes |
| 13 | Tspan8 | 2252 | 0.322 | 0.1840 | Yes |
| 14 | Clcn3 | 2293 | 0.319 | 0.1990 | Yes |
| 15 | Atp6v1h | 2314 | 0.317 | 0.2150 | Yes |
| 16 | Bet1 | 2398 | 0.311 | 0.2274 | Yes |
| 17 | Ap1g1 | 2534 | 0.303 | 0.2366 | Yes |
| 18 | Lamp2 | 2559 | 0.301 | 0.2515 | Yes |
| 19 | Vamp4 | 2855 | 0.279 | 0.2511 | Yes |
| 20 | Galc | 2898 | 0.276 | 0.2638 | Yes |
| 21 | Dnm1l | 3009 | 0.269 | 0.2725 | Yes |
| 22 | Ap3s1 | 3211 | 0.257 | 0.2759 | Yes |
| 23 | Uso1 | 3370 | 0.247 | 0.2809 | Yes |
| 24 | Vamp3 | 3986 | 0.213 | 0.2603 | Yes |
| 25 | Stx12 | 4392 | 0.195 | 0.2497 | Yes |
| 26 | Pam | 4542 | 0.186 | 0.2520 | Yes |
| 27 | Snx2 | 4565 | 0.185 | 0.2608 | Yes |
| 28 | Tpd52 | 4606 | 0.183 | 0.2685 | Yes |
| 29 | Lman1 | 4672 | 0.181 | 0.2749 | Yes |
| 30 | Rab2a | 4700 | 0.179 | 0.2831 | Yes |
| 31 | Golga4 | 4773 | 0.176 | 0.2888 | Yes |
| 32 | Atp1a1 | 5219 | 0.158 | 0.2741 | Yes |
| 33 | Anp32e | 5354 | 0.152 | 0.2753 | Yes |
| 34 | Ica1 | 5371 | 0.151 | 0.2826 | Yes |
| 35 | Arfgef1 | 5379 | 0.151 | 0.2903 | Yes |
| 36 | Arfip1 | 5428 | 0.149 | 0.2958 | Yes |
| 37 | Rps6ka3 | 5589 | 0.143 | 0.2952 | Yes |
| 38 | Rab5a | 5644 | 0.140 | 0.2999 | Yes |
| 39 | Ap3b1 | 5760 | 0.135 | 0.3012 | Yes |
| 40 | Yipf6 | 5798 | 0.134 | 0.3064 | Yes |
| 41 | Snap23 | 5833 | 0.132 | 0.3117 | Yes |
| 42 | Stx16 | 6247 | 0.113 | 0.2963 | No |
| 43 | Copb1 | 6391 | 0.108 | 0.2947 | No |
| 44 | Ap2m1 | 6522 | 0.102 | 0.2934 | No |
| 45 | Ocrl | 6636 | 0.098 | 0.2928 | No |
| 46 | Sec31a | 6811 | 0.091 | 0.2886 | No |
| 47 | Ap2b1 | 6996 | 0.084 | 0.2835 | No |
| 48 | Arfgef2 | 7073 | 0.081 | 0.2839 | No |
| 49 | Dop1a | 7141 | 0.078 | 0.2846 | No |
| 50 | Napa | 7342 | 0.071 | 0.2780 | No |
| 51 | Adam10 | 7477 | 0.066 | 0.2746 | No |
| 52 | Vps45 | 7522 | 0.064 | 0.2757 | No |
| 53 | Mapk1 | 7547 | 0.062 | 0.2778 | No |
| 54 | Tmx1 | 7585 | 0.061 | 0.2791 | No |
| 55 | Arf1 | 7617 | 0.060 | 0.2807 | No |
| 56 | Gosr2 | 7821 | 0.053 | 0.2730 | No |
| 57 | Kif1b | 8248 | 0.036 | 0.2528 | No |
| 58 | Sgms1 | 8331 | 0.033 | 0.2503 | No |
| 59 | Napg | 8644 | 0.022 | 0.2352 | No |
| 60 | Scamp1 | 8897 | 0.012 | 0.2228 | No |
| 61 | Tmed10 | 9060 | 0.007 | 0.2147 | No |
| 62 | Atp7a | 9289 | -0.000 | 0.2028 | No |
| 63 | Mon2 | 9365 | -0.003 | 0.1991 | No |
| 64 | Gbf1 | 9408 | -0.004 | 0.1971 | No |
| 65 | Igf2r | 9493 | -0.007 | 0.1932 | No |
| 66 | Cog2 | 9649 | -0.012 | 0.1858 | No |
| 67 | Rab22a | 9780 | -0.017 | 0.1799 | No |
| 68 | Vps4b | 9911 | -0.022 | 0.1743 | No |
| 69 | Arcn1 | 10477 | -0.044 | 0.1473 | No |
| 70 | Tsg101 | 10512 | -0.046 | 0.1480 | No |
| 71 | Tom1l1 | 10577 | -0.048 | 0.1472 | No |
| 72 | Ergic3 | 10643 | -0.051 | 0.1465 | No |
| 73 | Rer1 | 11099 | -0.068 | 0.1265 | No |
| 74 | Sec22b | 11687 | -0.090 | 0.1008 | No |
| 75 | M6pr | 12070 | -0.107 | 0.0867 | No |
| 76 | Sod1 | 12072 | -0.108 | 0.0925 | No |
| 77 | Cln5 | 12213 | -0.113 | 0.0912 | No |
| 78 | Cope | 12552 | -0.127 | 0.0805 | No |
| 79 | Ap2s1 | 12943 | -0.145 | 0.0680 | No |
| 80 | Clta | 13875 | -0.185 | 0.0295 | No |
| 81 | Rab14 | 14455 | -0.214 | 0.0108 | No |
| 82 | Scamp3 | 14744 | -0.229 | 0.0081 | No |
| 83 | Gnas | 14775 | -0.230 | 0.0189 | No |
| 84 | Krt18 | 15339 | -0.260 | 0.0036 | No |
| 85 | Scrn1 | 17097 | -0.381 | -0.0674 | No |
| 86 | Bnip3 | 17132 | -0.384 | -0.0486 | No |
| 87 | Gla | 17224 | -0.392 | -0.0322 | No |
| 88 | Sh3gl2 | 18162 | -0.490 | -0.0547 | No |
| 89 | Rab9 | 18177 | -0.493 | -0.0289 | No |
| 90 | Cd63 | 18186 | -0.494 | -0.0028 | No |
| 91 | Ykt6 | 18351 | -0.524 | 0.0168 | No |
| 92 | Cav2 | 18768 | -0.614 | 0.0280 | No |