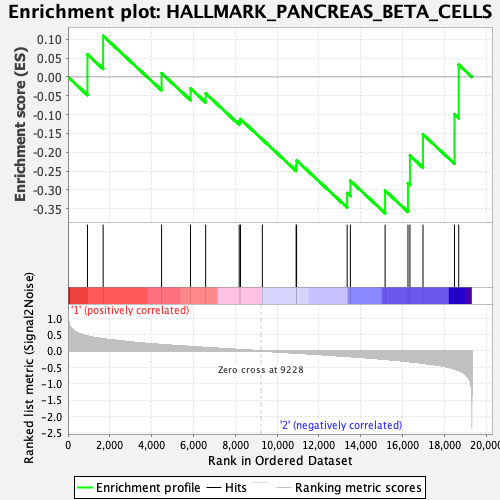
Profile of the Running ES Score & Positions of GeneSet Members on the Rank Ordered List
| Dataset | MEP.MEP.mega_Pheno.cls #Group2_versus_Group3.MEP.mega_Pheno.cls #Group2_versus_Group3_repos |
| Phenotype | MEP.mega_Pheno.cls#Group2_versus_Group3_repos |
| Upregulated in class | 2 |
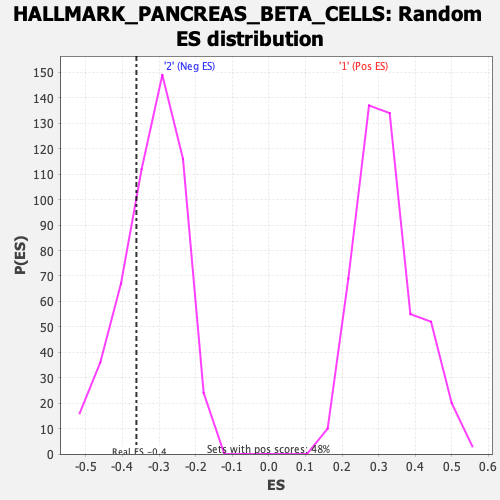
| GeneSet | HALLMARK_PANCREAS_BETA_CELLS |
| Enrichment Score (ES) | -0.3618704 |
| Normalized Enrichment Score (NES) | -1.1342864 |
| Nominal p-value | 0.27115384 |
| FDR q-value | 0.9507238 |
| FWER p-Value | 0.964 |
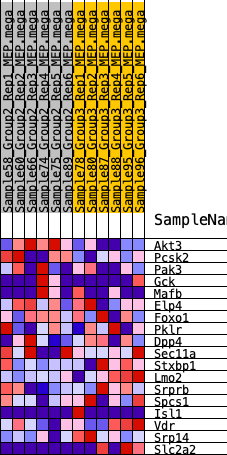
| SYMBOL | RANK IN GENE LIST | RANK METRIC SCORE | RUNNING ES | CORE ENRICHMENT | |
|---|---|---|---|---|---|
| 1 | Akt3 | 930 | 0.451 | 0.0601 | No |
| 2 | Pcsk2 | 1680 | 0.366 | 0.1092 | No |
| 3 | Pak3 | 4474 | 0.190 | 0.0100 | No |
| 4 | Gck | 5858 | 0.131 | -0.0302 | No |
| 5 | Mafb | 6581 | 0.100 | -0.0437 | No |
| 6 | Elp4 | 8185 | 0.038 | -0.1175 | No |
| 7 | Foxo1 | 8246 | 0.036 | -0.1119 | No |
| 8 | Pklr | 9292 | -0.000 | -0.1661 | No |
| 9 | Dpp4 | 10907 | -0.060 | -0.2353 | No |
| 10 | Sec11a | 10930 | -0.061 | -0.2218 | No |
| 11 | Stxbp1 | 13346 | -0.161 | -0.3083 | Yes |
| 12 | Lmo2 | 13502 | -0.168 | -0.2759 | Yes |
| 13 | Srprb | 15161 | -0.250 | -0.3018 | Yes |
| 14 | Spcs1 | 16255 | -0.318 | -0.2820 | Yes |
| 15 | Isl1 | 16349 | -0.325 | -0.2088 | Yes |
| 16 | Vdr | 16973 | -0.369 | -0.1526 | Yes |
| 17 | Srp14 | 18478 | -0.548 | -0.0991 | Yes |
| 18 | Slc2a2 | 18681 | -0.592 | 0.0325 | Yes |