Profile of the Running ES Score & Positions of GeneSet Members on the Rank Ordered List
| Dataset | MEP.MEP.mega_Pheno.cls #Group2_versus_Group3.MEP.mega_Pheno.cls #Group2_versus_Group3_repos |
| Phenotype | MEP.mega_Pheno.cls#Group2_versus_Group3_repos |
| Upregulated in class | 2 |
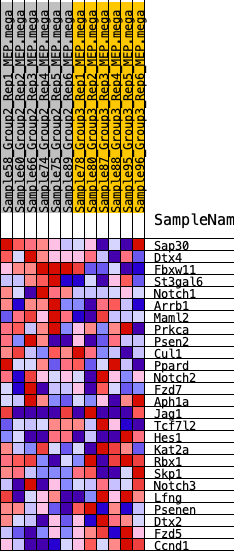
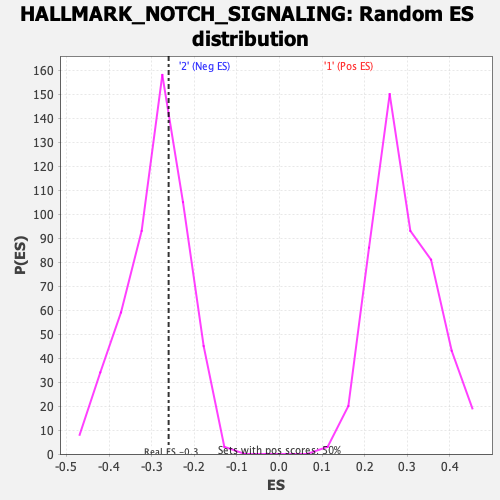
| GeneSet | HALLMARK_NOTCH_SIGNALING |
| Enrichment Score (ES) | -0.26011726 |
| Normalized Enrichment Score (NES) | -0.9017567 |
| Nominal p-value | 0.62574255 |
| FDR q-value | 0.9348537 |
| FWER p-Value | 0.998 |
| SYMBOL | RANK IN GENE LIST | RANK METRIC SCORE | RUNNING ES | CORE ENRICHMENT | |
|---|---|---|---|---|---|
| 1 | Sap30 | 542 | 0.526 | 0.0528 | Yes |
| 2 | Dtx4 | 562 | 0.523 | 0.1322 | Yes |
| 3 | Fbxw11 | 1831 | 0.354 | 0.1208 | Yes |
| 4 | St3gal6 | 1960 | 0.344 | 0.1672 | Yes |
| 5 | Notch1 | 3031 | 0.268 | 0.1529 | Yes |
| 6 | Arrb1 | 3102 | 0.264 | 0.1899 | Yes |
| 7 | Maml2 | 3583 | 0.235 | 0.2011 | Yes |
| 8 | Prkca | 4486 | 0.190 | 0.1835 | No |
| 9 | Psen2 | 5008 | 0.166 | 0.1820 | No |
| 10 | Cul1 | 5608 | 0.141 | 0.1727 | No |
| 11 | Ppard | 6488 | 0.104 | 0.1430 | No |
| 12 | Notch2 | 7208 | 0.075 | 0.1173 | No |
| 13 | Fzd7 | 8203 | 0.038 | 0.0715 | No |
| 14 | Aph1a | 8380 | 0.031 | 0.0672 | No |
| 15 | Jag1 | 9416 | -0.005 | 0.0143 | No |
| 16 | Tcf7l2 | 10125 | -0.030 | -0.0178 | No |
| 17 | Hes1 | 10646 | -0.051 | -0.0370 | No |
| 18 | Kat2a | 11842 | -0.097 | -0.0840 | No |
| 19 | Rbx1 | 12069 | -0.107 | -0.0792 | No |
| 20 | Skp1 | 12765 | -0.137 | -0.0943 | No |
| 21 | Notch3 | 14109 | -0.196 | -0.1337 | No |
| 22 | Lfng | 14601 | -0.221 | -0.1252 | No |
| 23 | Psenen | 14811 | -0.232 | -0.1004 | No |
| 24 | Dtx2 | 17226 | -0.392 | -0.1653 | No |
| 25 | Fzd5 | 19056 | -0.744 | -0.1457 | No |
| 26 | Ccnd1 | 19270 | -1.031 | 0.0019 | No |