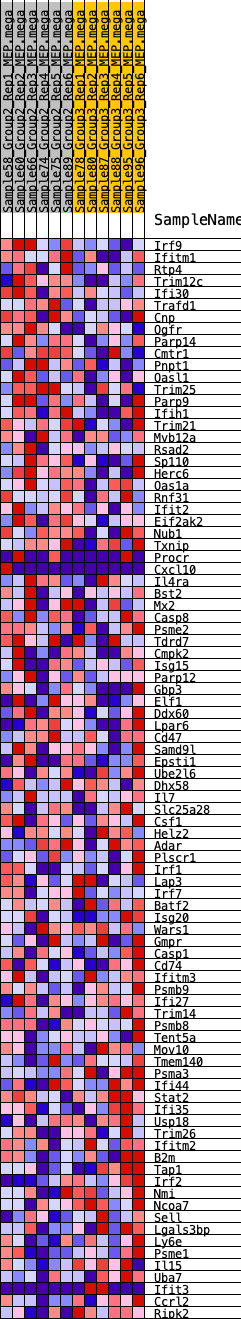
Profile of the Running ES Score & Positions of GeneSet Members on the Rank Ordered List
| Dataset | MEP.MEP.mega_Pheno.cls #Group2_versus_Group3.MEP.mega_Pheno.cls #Group2_versus_Group3_repos |
| Phenotype | MEP.mega_Pheno.cls#Group2_versus_Group3_repos |
| Upregulated in class | 1 |
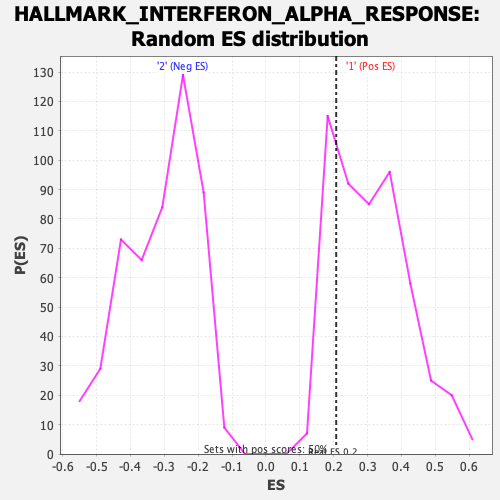
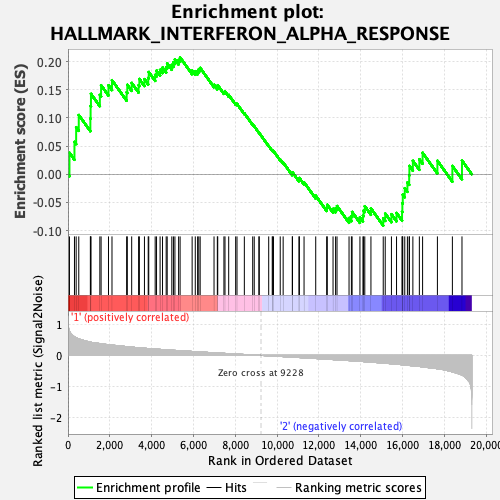
| GeneSet | HALLMARK_INTERFERON_ALPHA_RESPONSE |
| Enrichment Score (ES) | 0.20748584 |
| Normalized Enrichment Score (NES) | 0.66728544 |
| Nominal p-value | 0.7833002 |
| FDR q-value | 0.97237045 |
| FWER p-Value | 1.0 |
| SYMBOL | RANK IN GENE LIST | RANK METRIC SCORE | RUNNING ES | CORE ENRICHMENT | |
|---|---|---|---|---|---|
| 1 | Irf9 | 70 | 0.789 | 0.0382 | Yes |
| 2 | Ifitm1 | 309 | 0.600 | 0.0576 | Yes |
| 3 | Rtp4 | 390 | 0.569 | 0.0836 | Yes |
| 4 | Trim12c | 515 | 0.531 | 0.1053 | Yes |
| 5 | Ifi30 | 1069 | 0.429 | 0.0992 | Yes |
| 6 | Trafd1 | 1081 | 0.426 | 0.1213 | Yes |
| 7 | Cnp | 1098 | 0.424 | 0.1429 | Yes |
| 8 | Ogfr | 1523 | 0.382 | 0.1411 | Yes |
| 9 | Parp14 | 1582 | 0.378 | 0.1581 | Yes |
| 10 | Cmtr1 | 1936 | 0.346 | 0.1581 | Yes |
| 11 | Pnpt1 | 2103 | 0.332 | 0.1670 | Yes |
| 12 | Oasl1 | 2804 | 0.283 | 0.1456 | Yes |
| 13 | Trim25 | 2835 | 0.281 | 0.1589 | Yes |
| 14 | Parp9 | 3045 | 0.267 | 0.1622 | Yes |
| 15 | Ifih1 | 3376 | 0.247 | 0.1581 | Yes |
| 16 | Trim21 | 3412 | 0.245 | 0.1692 | Yes |
| 17 | Mvb12a | 3655 | 0.231 | 0.1689 | Yes |
| 18 | Rsad2 | 3835 | 0.221 | 0.1713 | Yes |
| 19 | Sp110 | 3861 | 0.220 | 0.1816 | Yes |
| 20 | Herc6 | 4168 | 0.206 | 0.1766 | Yes |
| 21 | Oas1a | 4233 | 0.203 | 0.1841 | Yes |
| 22 | Rnf31 | 4403 | 0.194 | 0.1856 | Yes |
| 23 | Ifit2 | 4519 | 0.188 | 0.1896 | Yes |
| 24 | Eif2ak2 | 4694 | 0.180 | 0.1900 | Yes |
| 25 | Nub1 | 4742 | 0.178 | 0.1970 | Yes |
| 26 | Txnip | 4964 | 0.168 | 0.1944 | Yes |
| 27 | Procr | 5041 | 0.164 | 0.1992 | Yes |
| 28 | Cxcl10 | 5112 | 0.161 | 0.2040 | Yes |
| 29 | Il4ra | 5289 | 0.155 | 0.2031 | Yes |
| 30 | Bst2 | 5360 | 0.152 | 0.2075 | Yes |
| 31 | Mx2 | 5935 | 0.128 | 0.1844 | No |
| 32 | Casp8 | 6085 | 0.120 | 0.1830 | No |
| 33 | Psme2 | 6197 | 0.115 | 0.1833 | No |
| 34 | Tdrd7 | 6253 | 0.113 | 0.1864 | No |
| 35 | Cmpk2 | 6319 | 0.111 | 0.1889 | No |
| 36 | Isg15 | 6982 | 0.084 | 0.1589 | No |
| 37 | Parp12 | 7140 | 0.078 | 0.1549 | No |
| 38 | Gbp3 | 7159 | 0.077 | 0.1581 | No |
| 39 | Elf1 | 7455 | 0.066 | 0.1462 | No |
| 40 | Ddx60 | 7506 | 0.064 | 0.1470 | No |
| 41 | Lpar6 | 7683 | 0.058 | 0.1409 | No |
| 42 | Cd47 | 8016 | 0.045 | 0.1261 | No |
| 43 | Samd9l | 8080 | 0.042 | 0.1250 | No |
| 44 | Epsti1 | 8431 | 0.029 | 0.1084 | No |
| 45 | Ube2l6 | 8831 | 0.015 | 0.0884 | No |
| 46 | Dhx58 | 8904 | 0.012 | 0.0853 | No |
| 47 | Il7 | 9128 | 0.004 | 0.0739 | No |
| 48 | Slc25a28 | 9143 | 0.004 | 0.0733 | No |
| 49 | Csf1 | 9596 | -0.011 | 0.0504 | No |
| 50 | Helz2 | 9765 | -0.016 | 0.0425 | No |
| 51 | Adar | 9786 | -0.017 | 0.0424 | No |
| 52 | Plscr1 | 9824 | -0.018 | 0.0414 | No |
| 53 | Irf1 | 10147 | -0.031 | 0.0263 | No |
| 54 | Lap3 | 10287 | -0.036 | 0.0210 | No |
| 55 | Irf7 | 10723 | -0.053 | 0.0012 | No |
| 56 | Batf2 | 10734 | -0.053 | 0.0035 | No |
| 57 | Isg20 | 11043 | -0.066 | -0.0091 | No |
| 58 | Wars1 | 11062 | -0.066 | -0.0065 | No |
| 59 | Gmpr | 11286 | -0.075 | -0.0141 | No |
| 60 | Casp1 | 11844 | -0.097 | -0.0379 | No |
| 61 | Cd74 | 12368 | -0.119 | -0.0588 | No |
| 62 | Ifitm3 | 12396 | -0.120 | -0.0539 | No |
| 63 | Psmb9 | 12672 | -0.133 | -0.0612 | No |
| 64 | Ifi27 | 12794 | -0.138 | -0.0602 | No |
| 65 | Trim14 | 12862 | -0.140 | -0.0563 | No |
| 66 | Psmb8 | 13437 | -0.165 | -0.0774 | No |
| 67 | Tent5a | 13550 | -0.170 | -0.0742 | No |
| 68 | Mov10 | 13583 | -0.172 | -0.0667 | No |
| 69 | Tmem140 | 13958 | -0.189 | -0.0762 | No |
| 70 | Psma3 | 14103 | -0.196 | -0.0733 | No |
| 71 | Ifi44 | 14132 | -0.197 | -0.0643 | No |
| 72 | Stat2 | 14190 | -0.200 | -0.0567 | No |
| 73 | Ifi35 | 14484 | -0.216 | -0.0605 | No |
| 74 | Usp18 | 15072 | -0.246 | -0.0780 | No |
| 75 | Trim26 | 15167 | -0.251 | -0.0696 | No |
| 76 | Ifitm2 | 15464 | -0.268 | -0.0708 | No |
| 77 | B2m | 15708 | -0.280 | -0.0686 | No |
| 78 | Tap1 | 15972 | -0.300 | -0.0664 | No |
| 79 | Irf2 | 15987 | -0.301 | -0.0512 | No |
| 80 | Nmi | 16006 | -0.302 | -0.0361 | No |
| 81 | Ncoa7 | 16101 | -0.308 | -0.0247 | No |
| 82 | Sell | 16227 | -0.317 | -0.0144 | No |
| 83 | Lgals3bp | 16313 | -0.323 | -0.0017 | No |
| 84 | Ly6e | 16323 | -0.323 | 0.0149 | No |
| 85 | Psme1 | 16489 | -0.334 | 0.0240 | No |
| 86 | Il15 | 16799 | -0.355 | 0.0268 | No |
| 87 | Uba7 | 16954 | -0.368 | 0.0382 | No |
| 88 | Ifit3 | 17662 | -0.428 | 0.0241 | No |
| 89 | Ccrl2 | 18378 | -0.528 | 0.0149 | No |
| 90 | Ripk2 | 18837 | -0.630 | 0.0245 | No |