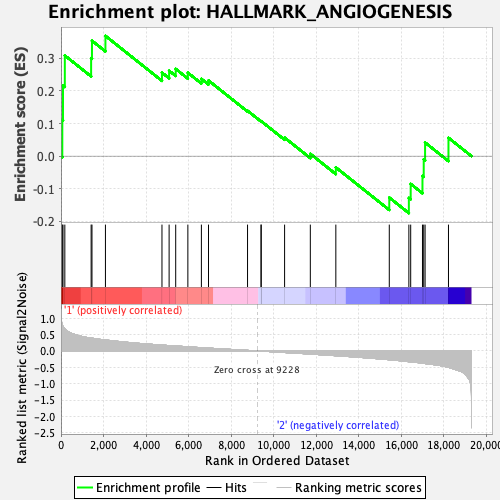
Profile of the Running ES Score & Positions of GeneSet Members on the Rank Ordered List
| Dataset | MEP.MEP.mega_Pheno.cls #Group2_versus_Group3.MEP.mega_Pheno.cls #Group2_versus_Group3_repos |
| Phenotype | MEP.mega_Pheno.cls#Group2_versus_Group3_repos |
| Upregulated in class | 1 |
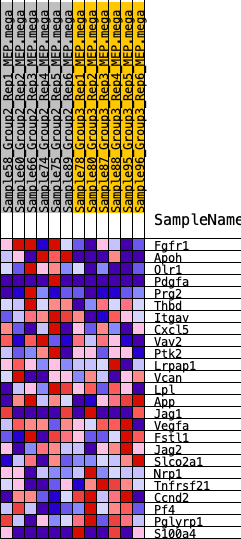
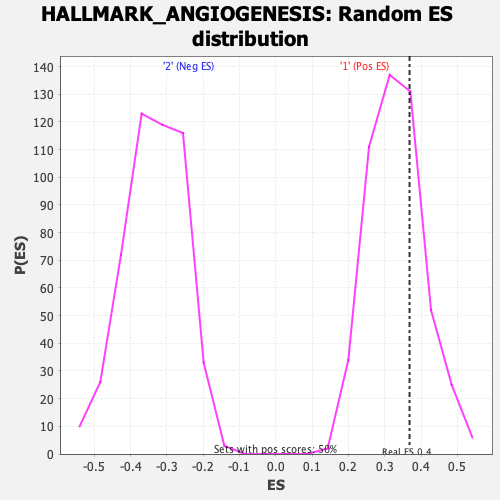
| GeneSet | HALLMARK_ANGIOGENESIS |
| Enrichment Score (ES) | 0.36837715 |
| Normalized Enrichment Score (NES) | 1.1207911 |
| Nominal p-value | 0.28514057 |
| FDR q-value | 0.7719785 |
| FWER p-Value | 0.972 |
| SYMBOL | RANK IN GENE LIST | RANK METRIC SCORE | RUNNING ES | CORE ENRICHMENT | |
|---|---|---|---|---|---|
| 1 | Fgfr1 | 62 | 0.801 | 0.1112 | Yes |
| 2 | Apoh | 94 | 0.747 | 0.2163 | Yes |
| 3 | Olr1 | 180 | 0.675 | 0.3083 | Yes |
| 4 | Pdgfa | 1417 | 0.392 | 0.3002 | Yes |
| 5 | Prg2 | 1457 | 0.388 | 0.3536 | Yes |
| 6 | Thbd | 2090 | 0.333 | 0.3684 | Yes |
| 7 | Itgav | 4749 | 0.177 | 0.2558 | No |
| 8 | Cxcl5 | 5085 | 0.162 | 0.2617 | No |
| 9 | Vav2 | 5395 | 0.150 | 0.2671 | No |
| 10 | Ptk2 | 5967 | 0.126 | 0.2555 | No |
| 11 | Lrpap1 | 6603 | 0.099 | 0.2367 | No |
| 12 | Vcan | 6938 | 0.086 | 0.2317 | No |
| 13 | Lpl | 8774 | 0.017 | 0.1390 | No |
| 14 | App | 9409 | -0.005 | 0.1068 | No |
| 15 | Jag1 | 9416 | -0.005 | 0.1071 | No |
| 16 | Vegfa | 10517 | -0.046 | 0.0567 | No |
| 17 | Fstl1 | 11727 | -0.092 | 0.0071 | No |
| 18 | Jag2 | 12927 | -0.144 | -0.0345 | No |
| 19 | Slco2a1 | 15441 | -0.266 | -0.1268 | No |
| 20 | Nrp1 | 16362 | -0.326 | -0.1279 | No |
| 21 | Tnfrsf21 | 16448 | -0.331 | -0.0851 | No |
| 22 | Ccnd2 | 17002 | -0.372 | -0.0606 | No |
| 23 | Pf4 | 17061 | -0.377 | -0.0097 | No |
| 24 | Pglyrp1 | 17125 | -0.383 | 0.0417 | No |
| 25 | S100a4 | 18225 | -0.500 | 0.0561 | No |