Profile of the Running ES Score & Positions of GeneSet Members on the Rank Ordered List
| Dataset | MEP.MEP.mega_Pheno.cls #Group1_versus_Group4.MEP.mega_Pheno.cls #Group1_versus_Group4_repos |
| Phenotype | MEP.mega_Pheno.cls#Group1_versus_Group4_repos |
| Upregulated in class | 3 |
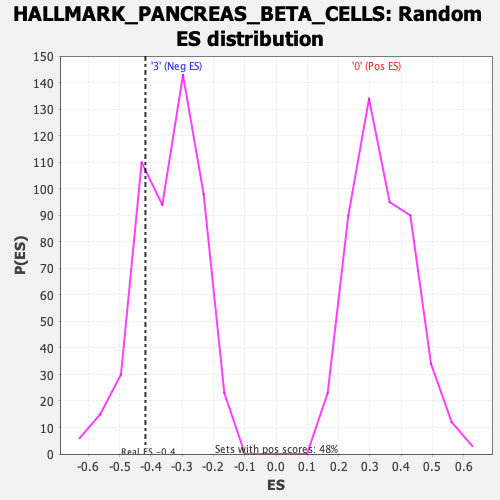
| GeneSet | HALLMARK_PANCREAS_BETA_CELLS |
| Enrichment Score (ES) | -0.417186 |
| Normalized Enrichment Score (NES) | -1.2224395 |
| Nominal p-value | 0.22928709 |
| FDR q-value | 0.5049295 |
| FWER p-Value | 0.872 |
| SYMBOL | RANK IN GENE LIST | RANK METRIC SCORE | RUNNING ES | CORE ENRICHMENT | |
|---|---|---|---|---|---|
| 1 | Mafb | 614 | 0.575 | 0.0879 | No |
| 2 | Pak3 | 1589 | 0.420 | 0.1248 | No |
| 3 | Foxo1 | 3545 | 0.268 | 0.0794 | No |
| 4 | Pcsk2 | 6196 | 0.130 | -0.0309 | No |
| 5 | Akt3 | 7331 | 0.084 | -0.0721 | No |
| 6 | Slc2a2 | 7596 | 0.073 | -0.0706 | No |
| 7 | Sec11a | 8795 | 0.022 | -0.1282 | No |
| 8 | Isl1 | 9185 | 0.005 | -0.1474 | No |
| 9 | Gck | 9322 | 0.000 | -0.1545 | No |
| 10 | Elp4 | 9495 | -0.004 | -0.1626 | No |
| 11 | Dpp4 | 12310 | -0.128 | -0.2818 | No |
| 12 | Lmo2 | 13057 | -0.160 | -0.2871 | No |
| 13 | Pklr | 15568 | -0.283 | -0.3584 | Yes |
| 14 | Srprb | 15909 | -0.304 | -0.3127 | Yes |
| 15 | Stxbp1 | 17905 | -0.469 | -0.3186 | Yes |
| 16 | Spcs1 | 18300 | -0.530 | -0.2287 | Yes |
| 17 | Vdr | 18668 | -0.605 | -0.1218 | Yes |
| 18 | Srp14 | 19035 | -0.744 | 0.0141 | Yes |