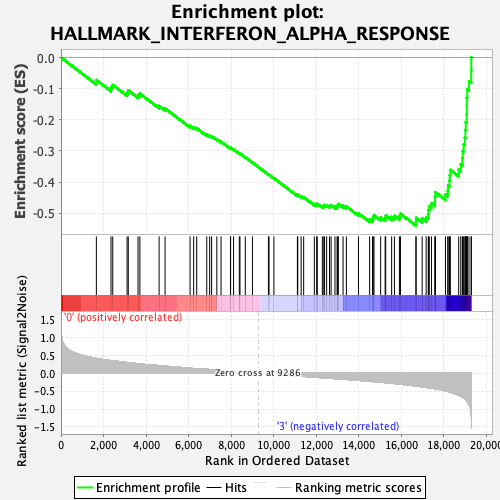
Profile of the Running ES Score & Positions of GeneSet Members on the Rank Ordered List
| Dataset | MEP.MEP.mega_Pheno.cls #Group1_versus_Group4.MEP.mega_Pheno.cls #Group1_versus_Group4_repos |
| Phenotype | MEP.mega_Pheno.cls#Group1_versus_Group4_repos |
| Upregulated in class | 3 |
| GeneSet | HALLMARK_INTERFERON_ALPHA_RESPONSE |
| Enrichment Score (ES) | -0.53994286 |
| Normalized Enrichment Score (NES) | -1.5483023 |
| Nominal p-value | 0.054435484 |
| FDR q-value | 0.2119518 |
| FWER p-Value | 0.283 |
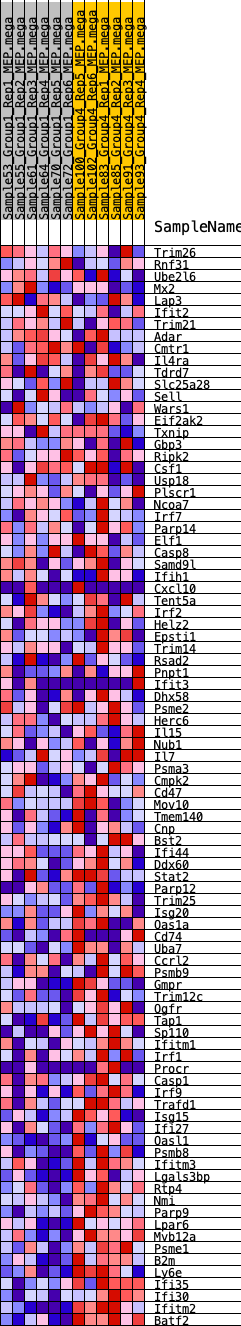
| SYMBOL | RANK IN GENE LIST | RANK METRIC SCORE | RUNNING ES | CORE ENRICHMENT | |
|---|---|---|---|---|---|
| 1 | Trim26 | 1663 | 0.409 | -0.0723 | No |
| 2 | Rnf31 | 2352 | 0.350 | -0.0959 | No |
| 3 | Ube2l6 | 2433 | 0.343 | -0.0881 | No |
| 4 | Mx2 | 3108 | 0.296 | -0.1129 | No |
| 5 | Lap3 | 3164 | 0.293 | -0.1056 | No |
| 6 | Ifit2 | 3623 | 0.262 | -0.1203 | No |
| 7 | Trim21 | 3710 | 0.257 | -0.1158 | No |
| 8 | Adar | 4614 | 0.209 | -0.1555 | No |
| 9 | Cmtr1 | 4895 | 0.194 | -0.1633 | No |
| 10 | Il4ra | 6071 | 0.136 | -0.2197 | No |
| 11 | Tdrd7 | 6241 | 0.129 | -0.2241 | No |
| 12 | Slc25a28 | 6383 | 0.123 | -0.2271 | No |
| 13 | Sell | 6856 | 0.107 | -0.2479 | No |
| 14 | Wars1 | 6993 | 0.101 | -0.2515 | No |
| 15 | Eif2ak2 | 7083 | 0.097 | -0.2528 | No |
| 16 | Txnip | 7330 | 0.084 | -0.2626 | No |
| 17 | Gbp3 | 7528 | 0.076 | -0.2702 | No |
| 18 | Ripk2 | 7971 | 0.055 | -0.2913 | No |
| 19 | Csf1 | 7978 | 0.054 | -0.2898 | No |
| 20 | Usp18 | 8117 | 0.049 | -0.2952 | No |
| 21 | Plscr1 | 8387 | 0.038 | -0.3079 | No |
| 22 | Ncoa7 | 8418 | 0.037 | -0.3082 | No |
| 23 | Irf7 | 8668 | 0.027 | -0.3202 | No |
| 24 | Parp14 | 9005 | 0.013 | -0.3372 | No |
| 25 | Elf1 | 9756 | -0.014 | -0.3758 | No |
| 26 | Casp8 | 9785 | -0.016 | -0.3767 | No |
| 27 | Samd9l | 10013 | -0.028 | -0.3875 | No |
| 28 | Ifih1 | 11119 | -0.076 | -0.4424 | No |
| 29 | Cxcl10 | 11136 | -0.077 | -0.4405 | No |
| 30 | Tent5a | 11295 | -0.084 | -0.4458 | No |
| 31 | Irf2 | 11414 | -0.090 | -0.4488 | No |
| 32 | Helz2 | 11914 | -0.113 | -0.4709 | No |
| 33 | Epsti1 | 12027 | -0.117 | -0.4726 | No |
| 34 | Trim14 | 12053 | -0.118 | -0.4698 | No |
| 35 | Rsad2 | 12293 | -0.128 | -0.4778 | No |
| 36 | Pnpt1 | 12361 | -0.131 | -0.4768 | No |
| 37 | Ifit3 | 12396 | -0.132 | -0.4740 | No |
| 38 | Dhx58 | 12495 | -0.136 | -0.4743 | No |
| 39 | Psme2 | 12630 | -0.142 | -0.4763 | No |
| 40 | Herc6 | 12705 | -0.145 | -0.4751 | No |
| 41 | Il15 | 12886 | -0.153 | -0.4792 | No |
| 42 | Nub1 | 12985 | -0.157 | -0.4788 | No |
| 43 | Il7 | 13011 | -0.158 | -0.4746 | No |
| 44 | Psma3 | 13044 | -0.160 | -0.4707 | No |
| 45 | Cmpk2 | 13267 | -0.169 | -0.4764 | No |
| 46 | Cd47 | 13423 | -0.175 | -0.4783 | No |
| 47 | Mov10 | 13991 | -0.201 | -0.5008 | No |
| 48 | Tmem140 | 14516 | -0.226 | -0.5202 | No |
| 49 | Cnp | 14651 | -0.233 | -0.5191 | No |
| 50 | Bst2 | 14683 | -0.235 | -0.5125 | No |
| 51 | Ifi44 | 14721 | -0.237 | -0.5062 | No |
| 52 | Ddx60 | 15035 | -0.253 | -0.5137 | No |
| 53 | Stat2 | 15246 | -0.266 | -0.5154 | No |
| 54 | Parp12 | 15274 | -0.268 | -0.5075 | No |
| 55 | Trim25 | 15552 | -0.281 | -0.5121 | No |
| 56 | Isg20 | 15683 | -0.290 | -0.5088 | No |
| 57 | Oas1a | 15917 | -0.304 | -0.5103 | No |
| 58 | Cd74 | 15966 | -0.308 | -0.5021 | No |
| 59 | Uba7 | 16695 | -0.358 | -0.5275 | Yes |
| 60 | Ccrl2 | 16701 | -0.358 | -0.5153 | Yes |
| 61 | Psmb9 | 16988 | -0.380 | -0.5169 | Yes |
| 62 | Gmpr | 17175 | -0.397 | -0.5128 | Yes |
| 63 | Trim12c | 17277 | -0.407 | -0.5039 | Yes |
| 64 | Ogfr | 17283 | -0.407 | -0.4900 | Yes |
| 65 | Tap1 | 17323 | -0.411 | -0.4777 | Yes |
| 66 | Sp110 | 17428 | -0.419 | -0.4686 | Yes |
| 67 | Ifitm1 | 17591 | -0.432 | -0.4619 | Yes |
| 68 | Irf1 | 17594 | -0.433 | -0.4470 | Yes |
| 69 | Procr | 17612 | -0.434 | -0.4327 | Yes |
| 70 | Casp1 | 18083 | -0.494 | -0.4400 | Yes |
| 71 | Irf9 | 18194 | -0.511 | -0.4280 | Yes |
| 72 | Trafd1 | 18208 | -0.513 | -0.4108 | Yes |
| 73 | Isg15 | 18272 | -0.525 | -0.3958 | Yes |
| 74 | Ifi27 | 18284 | -0.527 | -0.3780 | Yes |
| 75 | Oasl1 | 18312 | -0.533 | -0.3609 | Yes |
| 76 | Psmb8 | 18706 | -0.615 | -0.3600 | Yes |
| 77 | Ifitm3 | 18804 | -0.646 | -0.3425 | Yes |
| 78 | Lgals3bp | 18876 | -0.664 | -0.3231 | Yes |
| 79 | Rtp4 | 18896 | -0.672 | -0.3007 | Yes |
| 80 | Nmi | 18938 | -0.687 | -0.2790 | Yes |
| 81 | Parp9 | 18993 | -0.717 | -0.2568 | Yes |
| 82 | Lpar6 | 19021 | -0.735 | -0.2326 | Yes |
| 83 | Mvb12a | 19039 | -0.747 | -0.2075 | Yes |
| 84 | Psme1 | 19082 | -0.775 | -0.1827 | Yes |
| 85 | B2m | 19086 | -0.778 | -0.1558 | Yes |
| 86 | Ly6e | 19088 | -0.779 | -0.1287 | Yes |
| 87 | Ifi35 | 19111 | -0.798 | -0.1021 | Yes |
| 88 | Ifi30 | 19189 | -0.868 | -0.0759 | Yes |
| 89 | Ifitm2 | 19293 | -1.151 | -0.0412 | Yes |
| 90 | Batf2 | 19299 | -1.203 | 0.0004 | Yes |