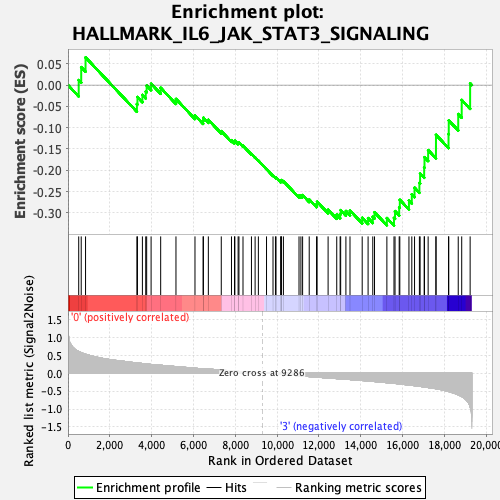
Profile of the Running ES Score & Positions of GeneSet Members on the Rank Ordered List
| Dataset | MEP.MEP.mega_Pheno.cls #Group1_versus_Group4.MEP.mega_Pheno.cls #Group1_versus_Group4_repos |
| Phenotype | MEP.mega_Pheno.cls#Group1_versus_Group4_repos |
| Upregulated in class | 3 |
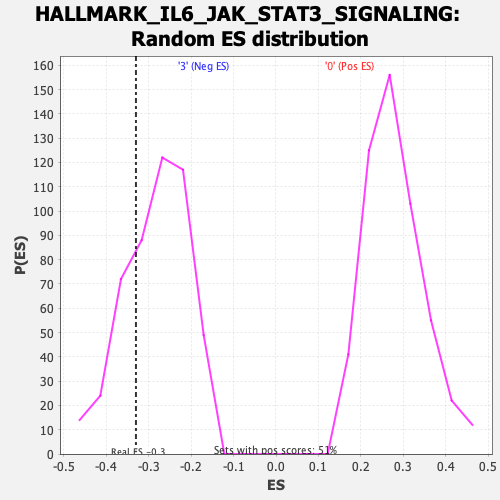
| GeneSet | HALLMARK_IL6_JAK_STAT3_SIGNALING |
| Enrichment Score (ES) | -0.3298679 |
| Normalized Enrichment Score (NES) | -1.1667875 |
| Nominal p-value | 0.26337448 |
| FDR q-value | 0.59837466 |
| FWER p-Value | 0.93 |
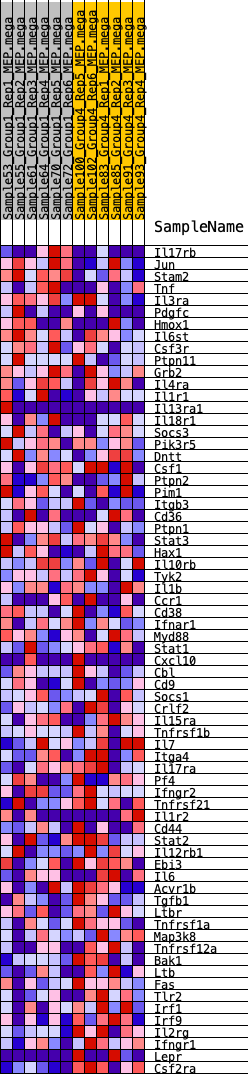
| SYMBOL | RANK IN GENE LIST | RANK METRIC SCORE | RUNNING ES | CORE ENRICHMENT | |
|---|---|---|---|---|---|
| 1 | Il17rb | 512 | 0.601 | 0.0118 | No |
| 2 | Jun | 632 | 0.572 | 0.0422 | No |
| 3 | Stam2 | 839 | 0.525 | 0.0650 | No |
| 4 | Tnf | 3294 | 0.282 | -0.0445 | No |
| 5 | Il3ra | 3321 | 0.280 | -0.0280 | No |
| 6 | Pdgfc | 3557 | 0.268 | -0.0231 | No |
| 7 | Hmox1 | 3717 | 0.256 | -0.0150 | No |
| 8 | Il6st | 3761 | 0.254 | -0.0010 | No |
| 9 | Csf3r | 3973 | 0.240 | 0.0034 | No |
| 10 | Ptpn11 | 4431 | 0.219 | -0.0063 | No |
| 11 | Grb2 | 5162 | 0.184 | -0.0325 | No |
| 12 | Il4ra | 6071 | 0.136 | -0.0710 | No |
| 13 | Il1r1 | 6459 | 0.120 | -0.0834 | No |
| 14 | Il13ra1 | 6475 | 0.120 | -0.0766 | No |
| 15 | Il18r1 | 6710 | 0.114 | -0.0814 | No |
| 16 | Socs3 | 7328 | 0.085 | -0.1081 | No |
| 17 | Pik3r5 | 7816 | 0.062 | -0.1294 | No |
| 18 | Dntt | 7961 | 0.055 | -0.1334 | No |
| 19 | Csf1 | 7978 | 0.054 | -0.1307 | No |
| 20 | Ptpn2 | 8134 | 0.049 | -0.1357 | No |
| 21 | Pim1 | 8173 | 0.047 | -0.1346 | No |
| 22 | Itgb3 | 8367 | 0.039 | -0.1422 | No |
| 23 | Cd36 | 8771 | 0.023 | -0.1617 | No |
| 24 | Ptpn1 | 8946 | 0.015 | -0.1698 | No |
| 25 | Stat3 | 9102 | 0.008 | -0.1773 | No |
| 26 | Hax1 | 9492 | -0.004 | -0.1973 | No |
| 27 | Il10rb | 9802 | -0.017 | -0.2123 | No |
| 28 | Tyk2 | 9919 | -0.022 | -0.2169 | No |
| 29 | Il1b | 9946 | -0.023 | -0.2168 | No |
| 30 | Ccr1 | 10169 | -0.035 | -0.2261 | No |
| 31 | Cd38 | 10194 | -0.036 | -0.2250 | No |
| 32 | Ifnar1 | 10202 | -0.037 | -0.2230 | No |
| 33 | Myd88 | 10299 | -0.041 | -0.2254 | No |
| 34 | Stat1 | 11045 | -0.073 | -0.2595 | No |
| 35 | Cxcl10 | 11136 | -0.077 | -0.2593 | No |
| 36 | Cbl | 11217 | -0.081 | -0.2583 | No |
| 37 | Cd9 | 11533 | -0.095 | -0.2685 | No |
| 38 | Socs1 | 11883 | -0.111 | -0.2796 | No |
| 39 | Crlf2 | 11910 | -0.112 | -0.2737 | No |
| 40 | Il15ra | 12436 | -0.133 | -0.2925 | No |
| 41 | Tnfrsf1b | 12849 | -0.152 | -0.3042 | No |
| 42 | Il7 | 13011 | -0.158 | -0.3025 | No |
| 43 | Itga4 | 13037 | -0.159 | -0.2936 | No |
| 44 | Il17ra | 13287 | -0.170 | -0.2957 | No |
| 45 | Pf4 | 13483 | -0.178 | -0.2944 | No |
| 46 | Ifngr2 | 14066 | -0.206 | -0.3115 | No |
| 47 | Tnfrsf21 | 14348 | -0.217 | -0.3123 | Yes |
| 48 | Il1r2 | 14572 | -0.229 | -0.3092 | Yes |
| 49 | Cd44 | 14655 | -0.234 | -0.2986 | Yes |
| 50 | Stat2 | 15246 | -0.266 | -0.3122 | Yes |
| 51 | Il12rb1 | 15586 | -0.284 | -0.3117 | Yes |
| 52 | Ebi3 | 15636 | -0.287 | -0.2959 | Yes |
| 53 | Il6 | 15835 | -0.298 | -0.2871 | Yes |
| 54 | Acvr1b | 15865 | -0.300 | -0.2694 | Yes |
| 55 | Tgfb1 | 16301 | -0.329 | -0.2710 | Yes |
| 56 | Ltbr | 16438 | -0.339 | -0.2564 | Yes |
| 57 | Tnfrsf1a | 16569 | -0.348 | -0.2409 | Yes |
| 58 | Map3k8 | 16801 | -0.366 | -0.2296 | Yes |
| 59 | Tnfrsf12a | 16835 | -0.369 | -0.2077 | Yes |
| 60 | Bak1 | 17029 | -0.384 | -0.1932 | Yes |
| 61 | Ltb | 17045 | -0.386 | -0.1693 | Yes |
| 62 | Fas | 17219 | -0.401 | -0.1527 | Yes |
| 63 | Tlr2 | 17593 | -0.433 | -0.1444 | Yes |
| 64 | Irf1 | 17594 | -0.433 | -0.1167 | Yes |
| 65 | Irf9 | 18194 | -0.511 | -0.1152 | Yes |
| 66 | Il2rg | 18205 | -0.512 | -0.0830 | Yes |
| 67 | Ifngr1 | 18658 | -0.603 | -0.0680 | Yes |
| 68 | Lepr | 18824 | -0.651 | -0.0349 | Yes |
| 69 | Csf2ra | 19227 | -0.939 | 0.0042 | Yes |