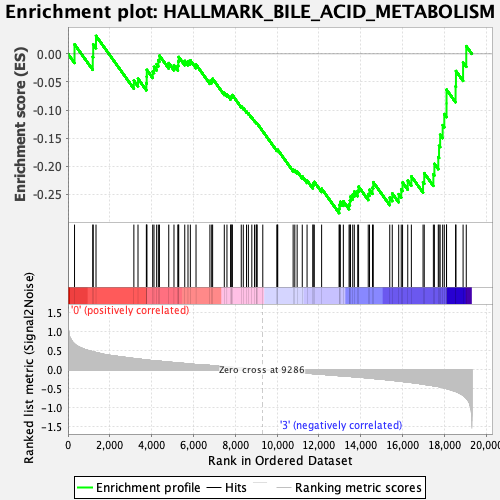
Profile of the Running ES Score & Positions of GeneSet Members on the Rank Ordered List
| Dataset | MEP.MEP.mega_Pheno.cls #Group1_versus_Group4.MEP.mega_Pheno.cls #Group1_versus_Group4_repos |
| Phenotype | MEP.mega_Pheno.cls#Group1_versus_Group4_repos |
| Upregulated in class | 3 |
| GeneSet | HALLMARK_BILE_ACID_METABOLISM |
| Enrichment Score (ES) | -0.2837491 |
| Normalized Enrichment Score (NES) | -1.1588849 |
| Nominal p-value | 0.2364341 |
| FDR q-value | 0.5292247 |
| FWER p-Value | 0.933 |
| SYMBOL | RANK IN GENE LIST | RANK METRIC SCORE | RUNNING ES | CORE ENRICHMENT | |
|---|---|---|---|---|---|
| 1 | Gnpat | 312 | 0.674 | 0.0170 | No |
| 2 | Tfcp2l1 | 1184 | 0.471 | -0.0051 | No |
| 3 | Npc1 | 1205 | 0.468 | 0.0169 | No |
| 4 | Paox | 1339 | 0.449 | 0.0321 | No |
| 5 | Cyp39a1 | 3149 | 0.293 | -0.0476 | No |
| 6 | Slc23a2 | 3347 | 0.278 | -0.0441 | No |
| 7 | Bmp6 | 3746 | 0.254 | -0.0523 | No |
| 8 | Slc22a18 | 3763 | 0.254 | -0.0406 | No |
| 9 | Pex6 | 3768 | 0.253 | -0.0284 | No |
| 10 | Amacr | 4049 | 0.237 | -0.0313 | No |
| 11 | Slc29a1 | 4111 | 0.233 | -0.0230 | No |
| 12 | Acsl1 | 4239 | 0.229 | -0.0183 | No |
| 13 | Slc35b2 | 4320 | 0.226 | -0.0113 | No |
| 14 | Nr3c2 | 4372 | 0.223 | -0.0030 | No |
| 15 | Pex1 | 4817 | 0.199 | -0.0164 | No |
| 16 | Ar | 5067 | 0.186 | -0.0201 | No |
| 17 | Abcg4 | 5254 | 0.179 | -0.0210 | No |
| 18 | Abca4 | 5274 | 0.178 | -0.0132 | No |
| 19 | Pfkm | 5294 | 0.177 | -0.0055 | No |
| 20 | Fdxr | 5582 | 0.161 | -0.0125 | No |
| 21 | Cyp7b1 | 5737 | 0.153 | -0.0129 | No |
| 22 | Aldh9a1 | 5850 | 0.147 | -0.0115 | No |
| 23 | Pex7 | 6121 | 0.134 | -0.0190 | No |
| 24 | Fads1 | 6785 | 0.111 | -0.0480 | No |
| 25 | Pecr | 6871 | 0.107 | -0.0472 | No |
| 26 | Aldh1a1 | 6915 | 0.104 | -0.0443 | No |
| 27 | Pex12 | 7473 | 0.079 | -0.0694 | No |
| 28 | Nedd4 | 7600 | 0.073 | -0.0724 | No |
| 29 | Fads2 | 7774 | 0.065 | -0.0782 | No |
| 30 | Abca2 | 7799 | 0.063 | -0.0763 | No |
| 31 | Idh2 | 7836 | 0.062 | -0.0752 | No |
| 32 | Pex19 | 7858 | 0.060 | -0.0733 | No |
| 33 | Dhcr24 | 8284 | 0.041 | -0.0934 | No |
| 34 | Abca8b | 8381 | 0.038 | -0.0965 | No |
| 35 | Nr1h4 | 8535 | 0.032 | -0.1028 | No |
| 36 | Gnmt | 8624 | 0.028 | -0.1060 | No |
| 37 | Optn | 8789 | 0.022 | -0.1135 | No |
| 38 | Abca9 | 8919 | 0.016 | -0.1194 | No |
| 39 | Slc27a5 | 8996 | 0.013 | -0.1227 | No |
| 40 | Acsl5 | 9027 | 0.012 | -0.1237 | No |
| 41 | Bcar3 | 9039 | 0.011 | -0.1237 | No |
| 42 | Gc | 9313 | 0.000 | -0.1379 | No |
| 43 | Abcd3 | 9984 | -0.026 | -0.1715 | No |
| 44 | Hsd3b7 | 10018 | -0.028 | -0.1718 | No |
| 45 | Lck | 10027 | -0.029 | -0.1708 | No |
| 46 | Crot | 10764 | -0.061 | -0.2061 | No |
| 47 | Pex26 | 10844 | -0.065 | -0.2071 | No |
| 48 | Idh1 | 10956 | -0.069 | -0.2094 | No |
| 49 | Slc23a1 | 11201 | -0.080 | -0.2182 | No |
| 50 | Hacl1 | 11430 | -0.090 | -0.2256 | No |
| 51 | Lonp2 | 11706 | -0.103 | -0.2348 | No |
| 52 | Pnpla8 | 11723 | -0.104 | -0.2305 | No |
| 53 | Pxmp2 | 11776 | -0.106 | -0.2280 | No |
| 54 | Abca6 | 12126 | -0.121 | -0.2402 | No |
| 55 | Nr0b2 | 12964 | -0.157 | -0.2760 | Yes |
| 56 | Abcd2 | 12976 | -0.157 | -0.2689 | Yes |
| 57 | Abca5 | 13021 | -0.158 | -0.2634 | Yes |
| 58 | Scp2 | 13165 | -0.165 | -0.2627 | Yes |
| 59 | Aqp9 | 13439 | -0.176 | -0.2682 | Yes |
| 60 | Gclm | 13478 | -0.177 | -0.2614 | Yes |
| 61 | Abcd1 | 13507 | -0.179 | -0.2541 | Yes |
| 62 | Hsd17b4 | 13614 | -0.183 | -0.2505 | Yes |
| 63 | Rxra | 13689 | -0.187 | -0.2452 | Yes |
| 64 | Cyp46a1 | 13853 | -0.194 | -0.2441 | Yes |
| 65 | Pex11a | 13893 | -0.196 | -0.2365 | Yes |
| 66 | Ephx2 | 14355 | -0.217 | -0.2497 | Yes |
| 67 | Atxn1 | 14416 | -0.221 | -0.2420 | Yes |
| 68 | Lipe | 14559 | -0.229 | -0.2381 | Yes |
| 69 | Abca3 | 14595 | -0.230 | -0.2286 | Yes |
| 70 | Rbp1 | 15383 | -0.274 | -0.2561 | Yes |
| 71 | Retsat | 15504 | -0.279 | -0.2486 | Yes |
| 72 | Pex13 | 15811 | -0.297 | -0.2499 | Yes |
| 73 | Isoc1 | 15933 | -0.306 | -0.2411 | Yes |
| 74 | Nudt12 | 15996 | -0.310 | -0.2291 | Yes |
| 75 | Mlycd | 16244 | -0.326 | -0.2259 | Yes |
| 76 | Idi1 | 16417 | -0.337 | -0.2182 | Yes |
| 77 | Gstk1 | 16976 | -0.379 | -0.2286 | Yes |
| 78 | Sult2b1 | 17033 | -0.384 | -0.2125 | Yes |
| 79 | Soat2 | 17469 | -0.423 | -0.2144 | Yes |
| 80 | Klf1 | 17518 | -0.427 | -0.1958 | Yes |
| 81 | Sod1 | 17704 | -0.442 | -0.1836 | Yes |
| 82 | Pex16 | 17741 | -0.447 | -0.1635 | Yes |
| 83 | Efhc1 | 17793 | -0.453 | -0.1439 | Yes |
| 84 | Cyp27a1 | 17914 | -0.470 | -0.1270 | Yes |
| 85 | Hsd17b11 | 17992 | -0.483 | -0.1072 | Yes |
| 86 | Prdx5 | 18098 | -0.497 | -0.0882 | Yes |
| 87 | Pex11g | 18099 | -0.497 | -0.0637 | Yes |
| 88 | Phyh | 18531 | -0.573 | -0.0579 | Yes |
| 89 | Abca1 | 18549 | -0.575 | -0.0305 | Yes |
| 90 | Dio2 | 18890 | -0.670 | -0.0152 | Yes |
| 91 | Cat | 19042 | -0.748 | 0.0138 | Yes |

