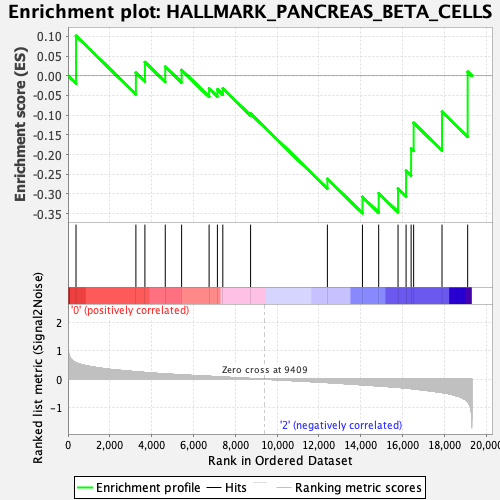
Profile of the Running ES Score & Positions of GeneSet Members on the Rank Ordered List
| Dataset | MEP.MEP.mega_Pheno.cls #Group1_versus_Group3.MEP.mega_Pheno.cls #Group1_versus_Group3_repos |
| Phenotype | MEP.mega_Pheno.cls#Group1_versus_Group3_repos |
| Upregulated in class | 2 |
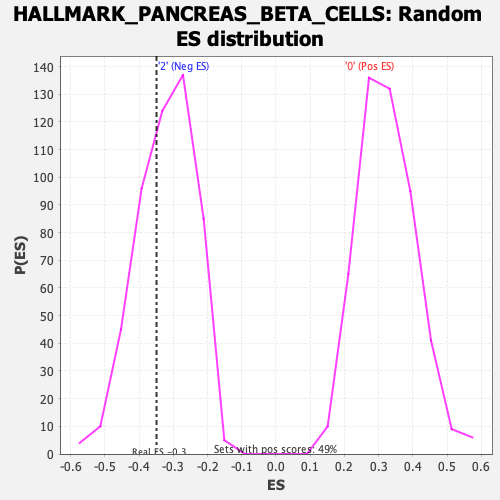
| GeneSet | HALLMARK_PANCREAS_BETA_CELLS |
| Enrichment Score (ES) | -0.34896213 |
| Normalized Enrichment Score (NES) | -1.0807021 |
| Nominal p-value | 0.37944663 |
| FDR q-value | 0.58433825 |
| FWER p-Value | 0.993 |
| SYMBOL | RANK IN GENE LIST | RANK METRIC SCORE | RUNNING ES | CORE ENRICHMENT | |
|---|---|---|---|---|---|
| 1 | Pcsk2 | 383 | 0.575 | 0.1014 | No |
| 2 | Akt3 | 3246 | 0.259 | 0.0077 | No |
| 3 | Dpp4 | 3677 | 0.234 | 0.0348 | No |
| 4 | Foxo1 | 4650 | 0.184 | 0.0233 | No |
| 5 | Isl1 | 5432 | 0.151 | 0.0147 | No |
| 6 | Mafb | 6746 | 0.101 | -0.0321 | No |
| 7 | Pak3 | 7143 | 0.085 | -0.0346 | No |
| 8 | Elp4 | 7402 | 0.075 | -0.0322 | No |
| 9 | Slc2a2 | 8730 | 0.023 | -0.0961 | No |
| 10 | Sec11a | 12402 | -0.115 | -0.2621 | No |
| 11 | Stxbp1 | 14078 | -0.195 | -0.3077 | Yes |
| 12 | Lmo2 | 14854 | -0.234 | -0.2984 | Yes |
| 13 | Gck | 15780 | -0.282 | -0.2868 | Yes |
| 14 | Pklr | 16164 | -0.310 | -0.2412 | Yes |
| 15 | Vdr | 16406 | -0.327 | -0.1846 | Yes |
| 16 | Srprb | 16526 | -0.338 | -0.1195 | Yes |
| 17 | Spcs1 | 17882 | -0.466 | -0.0914 | Yes |
| 18 | Srp14 | 19109 | -0.783 | 0.0103 | Yes |