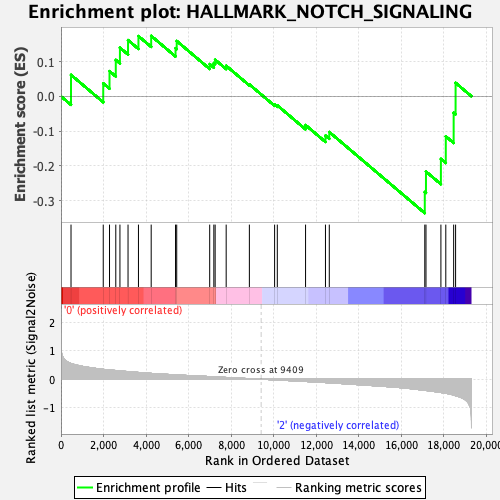
Profile of the Running ES Score & Positions of GeneSet Members on the Rank Ordered List
| Dataset | MEP.MEP.mega_Pheno.cls #Group1_versus_Group3.MEP.mega_Pheno.cls #Group1_versus_Group3_repos |
| Phenotype | MEP.mega_Pheno.cls#Group1_versus_Group3_repos |
| Upregulated in class | 2 |
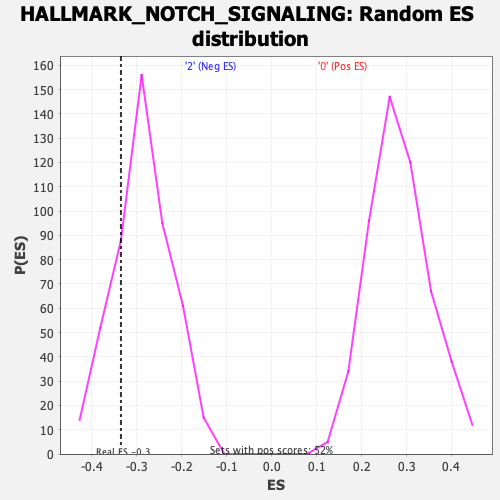
| GeneSet | HALLMARK_NOTCH_SIGNALING |
| Enrichment Score (ES) | -0.33539236 |
| Normalized Enrichment Score (NES) | -1.1676356 |
| Nominal p-value | 0.20790021 |
| FDR q-value | 0.6566619 |
| FWER p-Value | 0.962 |
| SYMBOL | RANK IN GENE LIST | RANK METRIC SCORE | RUNNING ES | CORE ENRICHMENT | |
|---|---|---|---|---|---|
| 1 | Notch1 | 471 | 0.550 | 0.0617 | No |
| 2 | Dtx4 | 1987 | 0.346 | 0.0371 | No |
| 3 | Prkca | 2282 | 0.322 | 0.0723 | No |
| 4 | Hes1 | 2577 | 0.303 | 0.1045 | No |
| 5 | Fbxw11 | 2772 | 0.289 | 0.1397 | No |
| 6 | Cul1 | 3153 | 0.265 | 0.1614 | No |
| 7 | Ppard | 3643 | 0.236 | 0.1730 | No |
| 8 | Sap30 | 4242 | 0.202 | 0.1736 | No |
| 9 | Jag1 | 5387 | 0.153 | 0.1382 | No |
| 10 | Arrb1 | 5443 | 0.151 | 0.1589 | No |
| 11 | St3gal6 | 6994 | 0.090 | 0.0926 | No |
| 12 | Psen2 | 7189 | 0.083 | 0.0956 | No |
| 13 | Aph1a | 7250 | 0.081 | 0.1052 | No |
| 14 | Notch2 | 7769 | 0.061 | 0.0878 | No |
| 15 | Kat2a | 8860 | 0.019 | 0.0342 | No |
| 16 | Fzd7 | 10047 | -0.023 | -0.0237 | No |
| 17 | Tcf7l2 | 10174 | -0.028 | -0.0259 | No |
| 18 | Maml2 | 11503 | -0.079 | -0.0824 | No |
| 19 | Skp1 | 12439 | -0.117 | -0.1127 | No |
| 20 | Dtx2 | 12619 | -0.124 | -0.1025 | No |
| 21 | Ccnd1 | 17111 | -0.388 | -0.2747 | Yes |
| 22 | Fzd5 | 17167 | -0.393 | -0.2160 | Yes |
| 23 | Notch3 | 17869 | -0.465 | -0.1796 | Yes |
| 24 | Rbx1 | 18099 | -0.490 | -0.1148 | Yes |
| 25 | Lfng | 18469 | -0.555 | -0.0472 | Yes |
| 26 | Psenen | 18560 | -0.579 | 0.0387 | Yes |