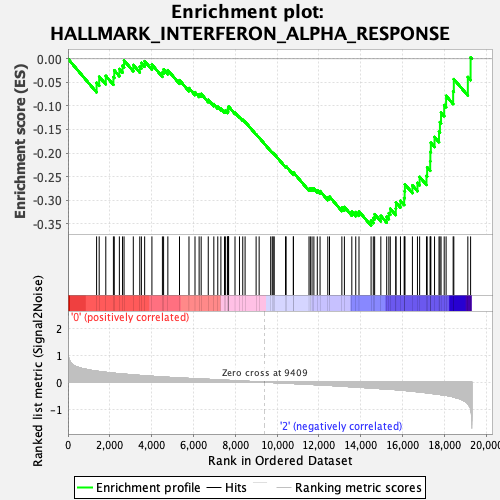
Profile of the Running ES Score & Positions of GeneSet Members on the Rank Ordered List
| Dataset | MEP.MEP.mega_Pheno.cls #Group1_versus_Group3.MEP.mega_Pheno.cls #Group1_versus_Group3_repos |
| Phenotype | MEP.mega_Pheno.cls#Group1_versus_Group3_repos |
| Upregulated in class | 2 |
| GeneSet | HALLMARK_INTERFERON_ALPHA_RESPONSE |
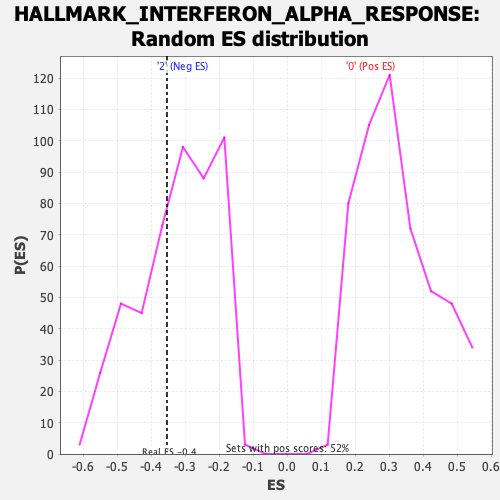
| Enrichment Score (ES) | -0.3540924 |
| Normalized Enrichment Score (NES) | -1.0982103 |
| Nominal p-value | 0.34639177 |
| FDR q-value | 0.6347514 |
| FWER p-Value | 0.989 |
| SYMBOL | RANK IN GENE LIST | RANK METRIC SCORE | RUNNING ES | CORE ENRICHMENT | |
|---|---|---|---|---|---|
| 1 | Txnip | 1367 | 0.405 | -0.0509 | No |
| 2 | Mx2 | 1491 | 0.392 | -0.0378 | No |
| 3 | Cmtr1 | 1807 | 0.362 | -0.0362 | No |
| 4 | Rsad2 | 2171 | 0.331 | -0.0386 | No |
| 5 | Eif2ak2 | 2212 | 0.328 | -0.0243 | No |
| 6 | Ifit2 | 2456 | 0.310 | -0.0216 | No |
| 7 | Isg15 | 2607 | 0.301 | -0.0144 | No |
| 8 | Cxcl10 | 2680 | 0.296 | -0.0034 | No |
| 9 | Trim21 | 3122 | 0.268 | -0.0130 | No |
| 10 | Slc25a28 | 3432 | 0.247 | -0.0168 | No |
| 11 | Oas1a | 3509 | 0.244 | -0.0086 | No |
| 12 | Nub1 | 3665 | 0.235 | -0.0050 | No |
| 13 | Parp9 | 4012 | 0.216 | -0.0122 | No |
| 14 | Tdrd7 | 4514 | 0.189 | -0.0289 | No |
| 15 | Trim12c | 4570 | 0.187 | -0.0224 | No |
| 16 | Herc6 | 4774 | 0.178 | -0.0241 | No |
| 17 | Rnf31 | 5331 | 0.155 | -0.0453 | No |
| 18 | Ifih1 | 5784 | 0.136 | -0.0621 | No |
| 19 | Il7 | 6072 | 0.125 | -0.0708 | No |
| 20 | Irf9 | 6269 | 0.119 | -0.0751 | No |
| 21 | Oasl1 | 6367 | 0.115 | -0.0744 | No |
| 22 | Usp18 | 6706 | 0.102 | -0.0869 | No |
| 23 | Lap3 | 6972 | 0.091 | -0.0962 | No |
| 24 | Elf1 | 7161 | 0.085 | -0.1017 | No |
| 25 | Wars1 | 7310 | 0.079 | -0.1055 | No |
| 26 | Mvb12a | 7482 | 0.071 | -0.1109 | No |
| 27 | Plscr1 | 7536 | 0.070 | -0.1101 | No |
| 28 | Trafd1 | 7632 | 0.066 | -0.1118 | No |
| 29 | Ifit3 | 7653 | 0.065 | -0.1096 | No |
| 30 | Ddx60 | 7655 | 0.065 | -0.1065 | No |
| 31 | Samd9l | 7662 | 0.065 | -0.1036 | No |
| 32 | Adar | 7679 | 0.064 | -0.1012 | No |
| 33 | Ifi44 | 7985 | 0.053 | -0.1144 | No |
| 34 | Irf7 | 8199 | 0.045 | -0.1233 | No |
| 35 | Parp14 | 8355 | 0.038 | -0.1294 | No |
| 36 | Sp110 | 8467 | 0.034 | -0.1335 | No |
| 37 | Trim25 | 8994 | 0.014 | -0.1602 | No |
| 38 | Cmpk2 | 9139 | 0.009 | -0.1673 | No |
| 39 | Rtp4 | 9691 | -0.009 | -0.1955 | No |
| 40 | Il15 | 9765 | -0.011 | -0.1987 | No |
| 41 | Psma3 | 9810 | -0.013 | -0.2004 | No |
| 42 | Ube2l6 | 9860 | -0.015 | -0.2022 | No |
| 43 | Psme2 | 10399 | -0.035 | -0.2284 | No |
| 44 | Uba7 | 10429 | -0.036 | -0.2282 | No |
| 45 | Cnp | 10775 | -0.049 | -0.2437 | No |
| 46 | Casp8 | 10777 | -0.049 | -0.2413 | No |
| 47 | Procr | 11523 | -0.080 | -0.2761 | No |
| 48 | Cd47 | 11588 | -0.082 | -0.2753 | No |
| 49 | Parp12 | 11668 | -0.085 | -0.2752 | No |
| 50 | Tmem140 | 11756 | -0.088 | -0.2754 | No |
| 51 | Pnpt1 | 11919 | -0.095 | -0.2791 | No |
| 52 | Gmpr | 12051 | -0.100 | -0.2809 | No |
| 53 | Helz2 | 12421 | -0.116 | -0.2943 | No |
| 54 | Csf1 | 12503 | -0.120 | -0.2926 | No |
| 55 | Ifitm3 | 13094 | -0.147 | -0.3160 | No |
| 56 | Gbp3 | 13215 | -0.153 | -0.3146 | No |
| 57 | Isg20 | 13570 | -0.170 | -0.3246 | No |
| 58 | Mov10 | 13758 | -0.179 | -0.3254 | No |
| 59 | Il4ra | 13913 | -0.187 | -0.3241 | No |
| 60 | Dhx58 | 14491 | -0.215 | -0.3434 | Yes |
| 61 | Irf2 | 14597 | -0.220 | -0.3379 | Yes |
| 62 | Sell | 14661 | -0.225 | -0.3300 | Yes |
| 63 | Ncoa7 | 14957 | -0.240 | -0.3334 | Yes |
| 64 | Ifitm1 | 15238 | -0.254 | -0.3353 | Yes |
| 65 | Bst2 | 15341 | -0.259 | -0.3277 | Yes |
| 66 | Trim14 | 15409 | -0.263 | -0.3181 | Yes |
| 67 | Lgals3bp | 15672 | -0.276 | -0.3180 | Yes |
| 68 | Epsti1 | 15681 | -0.277 | -0.3046 | Yes |
| 69 | Tent5a | 15896 | -0.290 | -0.3013 | Yes |
| 70 | Tap1 | 16073 | -0.304 | -0.2953 | Yes |
| 71 | Batf2 | 16096 | -0.307 | -0.2812 | Yes |
| 72 | Ifi27 | 16108 | -0.307 | -0.2665 | Yes |
| 73 | Trim26 | 16467 | -0.332 | -0.2686 | Yes |
| 74 | Ifi35 | 16708 | -0.354 | -0.2634 | Yes |
| 75 | Casp1 | 16812 | -0.362 | -0.2507 | Yes |
| 76 | Psme1 | 17140 | -0.391 | -0.2483 | Yes |
| 77 | Ogfr | 17172 | -0.394 | -0.2303 | Yes |
| 78 | Ripk2 | 17317 | -0.408 | -0.2175 | Yes |
| 79 | Cd74 | 17325 | -0.409 | -0.1975 | Yes |
| 80 | Ccrl2 | 17349 | -0.412 | -0.1782 | Yes |
| 81 | Stat2 | 17525 | -0.429 | -0.1659 | Yes |
| 82 | Psmb9 | 17739 | -0.449 | -0.1546 | Yes |
| 83 | Irf1 | 17783 | -0.454 | -0.1343 | Yes |
| 84 | Ifi30 | 17836 | -0.462 | -0.1140 | Yes |
| 85 | B2m | 17987 | -0.476 | -0.0981 | Yes |
| 86 | Psmb8 | 18078 | -0.486 | -0.0786 | Yes |
| 87 | Ly6e | 18415 | -0.545 | -0.0689 | Yes |
| 88 | Nmi | 18447 | -0.551 | -0.0431 | Yes |
| 89 | Lpar6 | 19117 | -0.790 | -0.0386 | Yes |
| 90 | Ifitm2 | 19249 | -0.972 | 0.0030 | Yes |