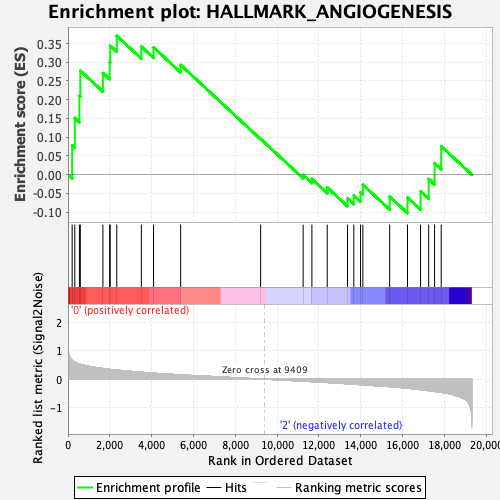
Profile of the Running ES Score & Positions of GeneSet Members on the Rank Ordered List
| Dataset | MEP.MEP.mega_Pheno.cls #Group1_versus_Group3.MEP.mega_Pheno.cls #Group1_versus_Group3_repos |
| Phenotype | MEP.mega_Pheno.cls#Group1_versus_Group3_repos |
| Upregulated in class | 0 |
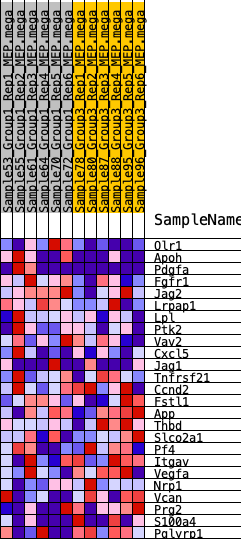
| GeneSet | HALLMARK_ANGIOGENESIS |
| Enrichment Score (ES) | 0.37032044 |
| Normalized Enrichment Score (NES) | 1.1644177 |
| Nominal p-value | 0.21370968 |
| FDR q-value | 1.0 |
| FWER p-Value | 0.94 |
| SYMBOL | RANK IN GENE LIST | RANK METRIC SCORE | RUNNING ES | CORE ENRICHMENT | |
|---|---|---|---|---|---|
| 1 | Olr1 | 199 | 0.671 | 0.0787 | Yes |
| 2 | Apoh | 325 | 0.596 | 0.1513 | Yes |
| 3 | Pdgfa | 546 | 0.531 | 0.2104 | Yes |
| 4 | Fgfr1 | 589 | 0.522 | 0.2774 | Yes |
| 5 | Jag2 | 1669 | 0.374 | 0.2711 | Yes |
| 6 | Lrpap1 | 1993 | 0.345 | 0.3001 | Yes |
| 7 | Lpl | 2018 | 0.342 | 0.3443 | Yes |
| 8 | Ptk2 | 2332 | 0.318 | 0.3703 | Yes |
| 9 | Vav2 | 3506 | 0.244 | 0.3418 | No |
| 10 | Cxcl5 | 4091 | 0.211 | 0.3396 | No |
| 11 | Jag1 | 5387 | 0.153 | 0.2927 | No |
| 12 | Tnfrsf21 | 9210 | 0.007 | 0.0955 | No |
| 13 | Ccnd2 | 11242 | -0.067 | -0.0010 | No |
| 14 | Fstl1 | 11661 | -0.084 | -0.0115 | No |
| 15 | App | 12395 | -0.115 | -0.0342 | No |
| 16 | Thbd | 13364 | -0.160 | -0.0632 | No |
| 17 | Slco2a1 | 13665 | -0.175 | -0.0556 | No |
| 18 | Pf4 | 13986 | -0.189 | -0.0470 | No |
| 19 | Itgav | 14097 | -0.196 | -0.0267 | No |
| 20 | Vegfa | 15380 | -0.261 | -0.0585 | No |
| 21 | Nrp1 | 16232 | -0.316 | -0.0608 | No |
| 22 | Vcan | 16857 | -0.366 | -0.0445 | No |
| 23 | Prg2 | 17246 | -0.400 | -0.0116 | No |
| 24 | S100a4 | 17528 | -0.430 | 0.0309 | No |
| 25 | Pglyrp1 | 17843 | -0.462 | 0.0759 | No |