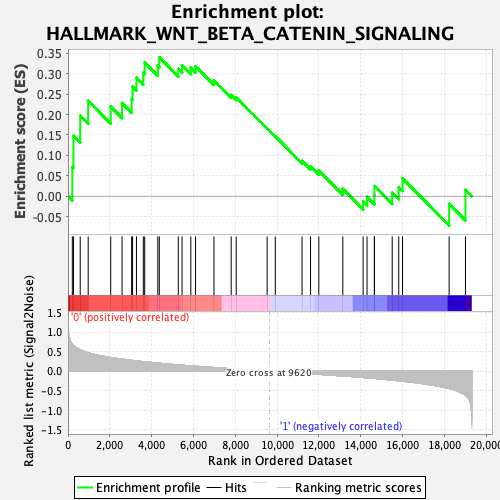
Profile of the Running ES Score & Positions of GeneSet Members on the Rank Ordered List
| Dataset | MEP.MEP.mega_Pheno.cls #Group1_versus_Group2.MEP.mega_Pheno.cls #Group1_versus_Group2_repos |
| Phenotype | MEP.mega_Pheno.cls#Group1_versus_Group2_repos |
| Upregulated in class | 0 |
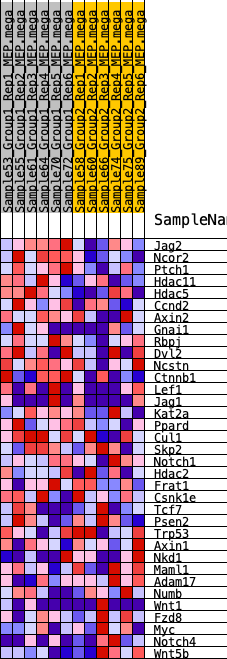
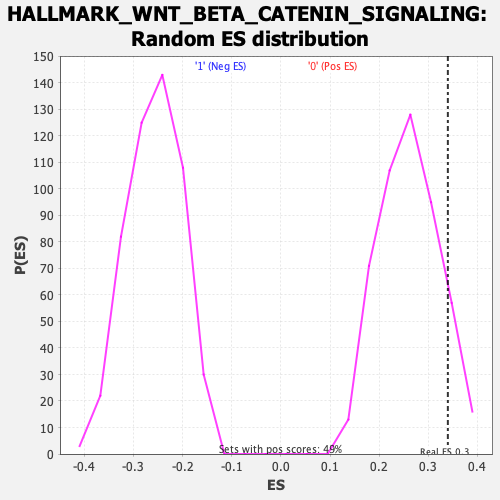
| GeneSet | HALLMARK_WNT_BETA_CATENIN_SIGNALING |
| Enrichment Score (ES) | 0.33980605 |
| Normalized Enrichment Score (NES) | 1.3016688 |
| Nominal p-value | 0.1026694 |
| FDR q-value | 1.0 |
| FWER p-Value | 0.808 |
| SYMBOL | RANK IN GENE LIST | RANK METRIC SCORE | RUNNING ES | CORE ENRICHMENT | |
|---|---|---|---|---|---|
| 1 | Jag2 | 206 | 0.684 | 0.0717 | Yes |
| 2 | Ncor2 | 260 | 0.657 | 0.1481 | Yes |
| 3 | Ptch1 | 584 | 0.544 | 0.1968 | Yes |
| 4 | Hdac11 | 965 | 0.469 | 0.2336 | Yes |
| 5 | Hdac5 | 2042 | 0.346 | 0.2194 | Yes |
| 6 | Ccnd2 | 2585 | 0.305 | 0.2280 | Yes |
| 7 | Axin2 | 3043 | 0.276 | 0.2375 | Yes |
| 8 | Gnai1 | 3087 | 0.273 | 0.2682 | Yes |
| 9 | Rbpj | 3273 | 0.261 | 0.2900 | Yes |
| 10 | Dvl2 | 3601 | 0.241 | 0.3020 | Yes |
| 11 | Ncstn | 3666 | 0.237 | 0.3273 | Yes |
| 12 | Ctnnb1 | 4294 | 0.204 | 0.3193 | Yes |
| 13 | Lef1 | 4366 | 0.201 | 0.3398 | Yes |
| 14 | Jag1 | 5274 | 0.158 | 0.3117 | No |
| 15 | Kat2a | 5453 | 0.150 | 0.3205 | No |
| 16 | Ppard | 5872 | 0.132 | 0.3148 | No |
| 17 | Cul1 | 6098 | 0.124 | 0.3180 | No |
| 18 | Skp2 | 6979 | 0.090 | 0.2833 | No |
| 19 | Notch1 | 7802 | 0.061 | 0.2480 | No |
| 20 | Hdac2 | 8043 | 0.052 | 0.2418 | No |
| 21 | Frat1 | 9521 | 0.004 | 0.1656 | No |
| 22 | Csnk1e | 9911 | -0.009 | 0.1464 | No |
| 23 | Tcf7 | 11190 | -0.051 | 0.0863 | No |
| 24 | Psen2 | 11597 | -0.067 | 0.0733 | No |
| 25 | Trp53 | 11992 | -0.081 | 0.0626 | No |
| 26 | Axin1 | 13139 | -0.123 | 0.0180 | No |
| 27 | Nkd1 | 14111 | -0.163 | -0.0128 | No |
| 28 | Maml1 | 14297 | -0.171 | -0.0017 | No |
| 29 | Adam17 | 14647 | -0.186 | 0.0026 | No |
| 30 | Numb | 14652 | -0.187 | 0.0249 | No |
| 31 | Wnt1 | 15501 | -0.230 | 0.0086 | No |
| 32 | Fzd8 | 15814 | -0.246 | 0.0219 | No |
| 33 | Myc | 15993 | -0.257 | 0.0436 | No |
| 34 | Notch4 | 18223 | -0.443 | -0.0187 | No |
| 35 | Wnt5b | 19003 | -0.622 | 0.0158 | No |