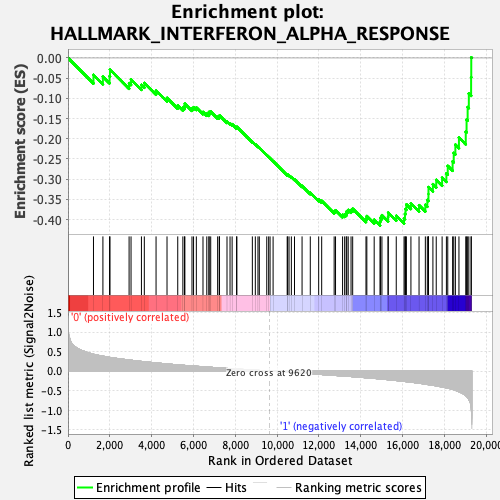
Profile of the Running ES Score & Positions of GeneSet Members on the Rank Ordered List
| Dataset | MEP.MEP.mega_Pheno.cls #Group1_versus_Group2.MEP.mega_Pheno.cls #Group1_versus_Group2_repos |
| Phenotype | MEP.mega_Pheno.cls#Group1_versus_Group2_repos |
| Upregulated in class | 1 |
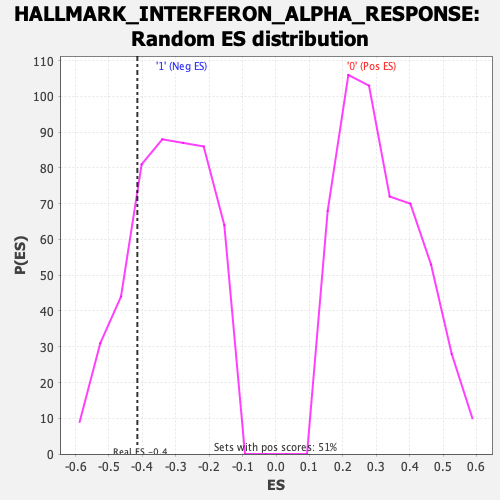
| GeneSet | HALLMARK_INTERFERON_ALPHA_RESPONSE |
| Enrichment Score (ES) | -0.41489282 |
| Normalized Enrichment Score (NES) | -1.2937351 |
| Nominal p-value | 0.20816326 |
| FDR q-value | 0.7413636 |
| FWER p-Value | 0.829 |
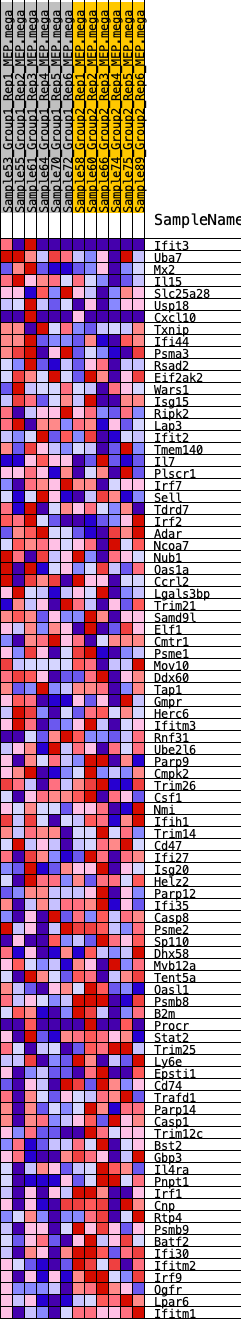
| SYMBOL | RANK IN GENE LIST | RANK METRIC SCORE | RUNNING ES | CORE ENRICHMENT | |
|---|---|---|---|---|---|
| 1 | Ifit3 | 1218 | 0.430 | -0.0419 | No |
| 2 | Uba7 | 1669 | 0.380 | -0.0464 | No |
| 3 | Mx2 | 1987 | 0.351 | -0.0453 | No |
| 4 | Il15 | 2007 | 0.349 | -0.0289 | No |
| 5 | Slc25a28 | 2921 | 0.283 | -0.0623 | No |
| 6 | Usp18 | 3014 | 0.278 | -0.0532 | No |
| 7 | Cxcl10 | 3511 | 0.246 | -0.0667 | No |
| 8 | Txnip | 3649 | 0.238 | -0.0619 | No |
| 9 | Ifi44 | 4210 | 0.207 | -0.0807 | No |
| 10 | Psma3 | 4734 | 0.183 | -0.0988 | No |
| 11 | Rsad2 | 5247 | 0.159 | -0.1175 | No |
| 12 | Eif2ak2 | 5492 | 0.148 | -0.1228 | No |
| 13 | Wars1 | 5569 | 0.145 | -0.1196 | No |
| 14 | Isg15 | 5588 | 0.144 | -0.1133 | No |
| 15 | Ripk2 | 5928 | 0.130 | -0.1244 | No |
| 16 | Lap3 | 6003 | 0.127 | -0.1220 | No |
| 17 | Ifit2 | 6136 | 0.122 | -0.1227 | No |
| 18 | Tmem140 | 6454 | 0.111 | -0.1337 | No |
| 19 | Il7 | 6636 | 0.103 | -0.1380 | No |
| 20 | Plscr1 | 6741 | 0.099 | -0.1384 | No |
| 21 | Irf7 | 6743 | 0.099 | -0.1335 | No |
| 22 | Sell | 6823 | 0.096 | -0.1328 | No |
| 23 | Tdrd7 | 7155 | 0.084 | -0.1458 | No |
| 24 | Irf2 | 7230 | 0.081 | -0.1456 | No |
| 25 | Adar | 7244 | 0.081 | -0.1423 | No |
| 26 | Ncoa7 | 7602 | 0.068 | -0.1574 | No |
| 27 | Nub1 | 7747 | 0.063 | -0.1618 | No |
| 28 | Oas1a | 7847 | 0.060 | -0.1640 | No |
| 29 | Ccrl2 | 8060 | 0.052 | -0.1724 | No |
| 30 | Lgals3bp | 8073 | 0.051 | -0.1705 | No |
| 31 | Trim21 | 8814 | 0.027 | -0.2076 | No |
| 32 | Samd9l | 8956 | 0.022 | -0.2139 | No |
| 33 | Elf1 | 9083 | 0.018 | -0.2195 | No |
| 34 | Cmtr1 | 9147 | 0.016 | -0.2220 | No |
| 35 | Psme1 | 9503 | 0.004 | -0.2402 | No |
| 36 | Mov10 | 9594 | 0.001 | -0.2449 | No |
| 37 | Ddx60 | 9661 | -0.000 | -0.2483 | No |
| 38 | Tap1 | 9806 | -0.005 | -0.2555 | No |
| 39 | Gmpr | 10480 | -0.028 | -0.2892 | No |
| 40 | Herc6 | 10501 | -0.028 | -0.2888 | No |
| 41 | Ifitm3 | 10568 | -0.031 | -0.2907 | No |
| 42 | Rnf31 | 10679 | -0.034 | -0.2947 | No |
| 43 | Ube2l6 | 10829 | -0.040 | -0.3005 | No |
| 44 | Parp9 | 11191 | -0.051 | -0.3167 | No |
| 45 | Cmpk2 | 11584 | -0.066 | -0.3338 | No |
| 46 | Trim26 | 11985 | -0.081 | -0.3505 | No |
| 47 | Csf1 | 12129 | -0.087 | -0.3536 | No |
| 48 | Nmi | 12725 | -0.109 | -0.3791 | No |
| 49 | Ifih1 | 12791 | -0.111 | -0.3770 | No |
| 50 | Trim14 | 13128 | -0.123 | -0.3883 | No |
| 51 | Cd47 | 13227 | -0.126 | -0.3871 | No |
| 52 | Ifi27 | 13302 | -0.129 | -0.3845 | No |
| 53 | Isg20 | 13329 | -0.131 | -0.3794 | No |
| 54 | Helz2 | 13397 | -0.133 | -0.3762 | No |
| 55 | Parp12 | 13533 | -0.138 | -0.3763 | No |
| 56 | Ifi35 | 13611 | -0.142 | -0.3733 | No |
| 57 | Casp8 | 14247 | -0.169 | -0.3978 | No |
| 58 | Psme2 | 14288 | -0.171 | -0.3914 | No |
| 59 | Sp110 | 14639 | -0.186 | -0.4003 | No |
| 60 | Dhx58 | 14920 | -0.200 | -0.4049 | Yes |
| 61 | Mvb12a | 14936 | -0.201 | -0.3956 | Yes |
| 62 | Tent5a | 15009 | -0.205 | -0.3892 | Yes |
| 63 | Oasl1 | 15304 | -0.220 | -0.3935 | Yes |
| 64 | Psmb8 | 15309 | -0.220 | -0.3827 | Yes |
| 65 | B2m | 15694 | -0.241 | -0.3907 | Yes |
| 66 | Procr | 16067 | -0.263 | -0.3969 | Yes |
| 67 | Stat2 | 16112 | -0.265 | -0.3860 | Yes |
| 68 | Trim25 | 16136 | -0.267 | -0.3739 | Yes |
| 69 | Ly6e | 16179 | -0.269 | -0.3626 | Yes |
| 70 | Epsti1 | 16396 | -0.283 | -0.3597 | Yes |
| 71 | Cd74 | 16784 | -0.309 | -0.3645 | Yes |
| 72 | Trafd1 | 17085 | -0.333 | -0.3634 | Yes |
| 73 | Parp14 | 17180 | -0.342 | -0.3513 | Yes |
| 74 | Casp1 | 17234 | -0.346 | -0.3368 | Yes |
| 75 | Trim12c | 17236 | -0.346 | -0.3196 | Yes |
| 76 | Bst2 | 17447 | -0.363 | -0.3124 | Yes |
| 77 | Gbp3 | 17606 | -0.377 | -0.3018 | Yes |
| 78 | Il4ra | 17887 | -0.404 | -0.2962 | Yes |
| 79 | Pnpt1 | 18092 | -0.426 | -0.2855 | Yes |
| 80 | Irf1 | 18157 | -0.434 | -0.2672 | Yes |
| 81 | Cnp | 18389 | -0.466 | -0.2560 | Yes |
| 82 | Rtp4 | 18443 | -0.474 | -0.2351 | Yes |
| 83 | Psmb9 | 18521 | -0.492 | -0.2145 | Yes |
| 84 | Batf2 | 18692 | -0.526 | -0.1971 | Yes |
| 85 | Ifi30 | 19018 | -0.627 | -0.1827 | Yes |
| 86 | Ifitm2 | 19057 | -0.643 | -0.1526 | Yes |
| 87 | Irf9 | 19108 | -0.673 | -0.1216 | Yes |
| 88 | Ogfr | 19165 | -0.727 | -0.0882 | Yes |
| 89 | Lpar6 | 19274 | -0.929 | -0.0475 | Yes |
| 90 | Ifitm1 | 19281 | -0.985 | 0.0014 | Yes |