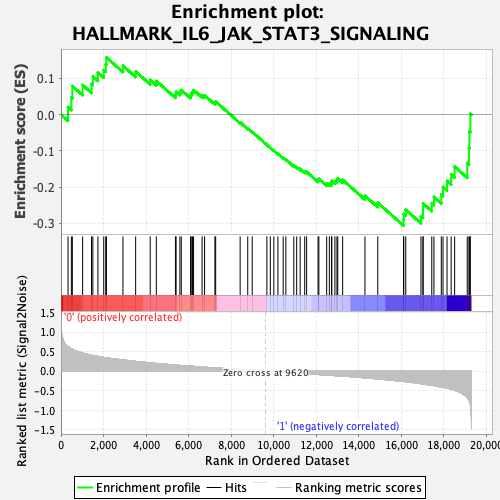
Profile of the Running ES Score & Positions of GeneSet Members on the Rank Ordered List
| Dataset | MEP.MEP.mega_Pheno.cls #Group1_versus_Group2.MEP.mega_Pheno.cls #Group1_versus_Group2_repos |
| Phenotype | MEP.mega_Pheno.cls#Group1_versus_Group2_repos |
| Upregulated in class | 1 |
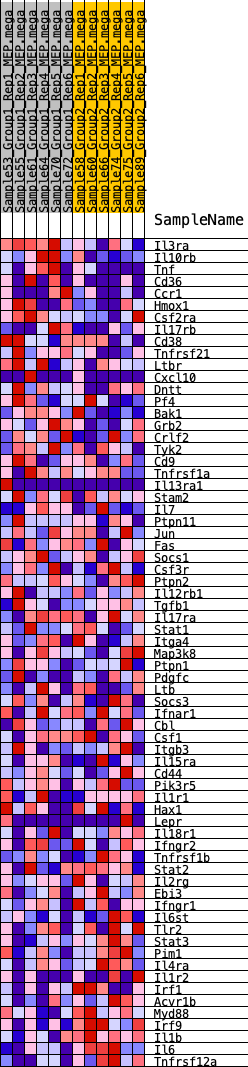
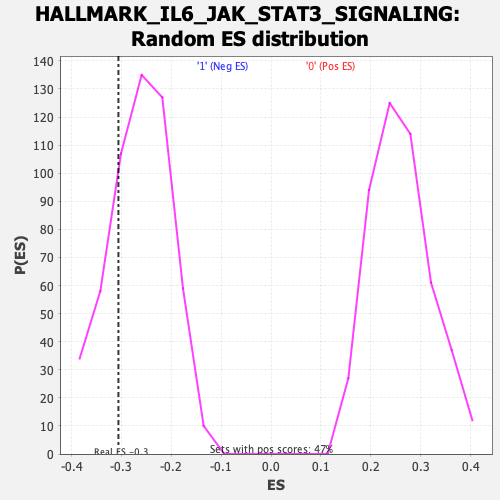
| GeneSet | HALLMARK_IL6_JAK_STAT3_SIGNALING |
| Enrichment Score (ES) | -0.30615208 |
| Normalized Enrichment Score (NES) | -1.1654323 |
| Nominal p-value | 0.22075471 |
| FDR q-value | 1.0 |
| FWER p-Value | 0.928 |
| SYMBOL | RANK IN GENE LIST | RANK METRIC SCORE | RUNNING ES | CORE ENRICHMENT | |
|---|---|---|---|---|---|
| 1 | Il3ra | 330 | 0.624 | 0.0208 | No |
| 2 | Il10rb | 488 | 0.569 | 0.0473 | No |
| 3 | Tnf | 533 | 0.557 | 0.0789 | No |
| 4 | Cd36 | 1017 | 0.460 | 0.0818 | No |
| 5 | Ccr1 | 1436 | 0.404 | 0.0846 | No |
| 6 | Hmox1 | 1498 | 0.398 | 0.1057 | No |
| 7 | Csf2ra | 1737 | 0.375 | 0.1161 | No |
| 8 | Il17rb | 2010 | 0.349 | 0.1232 | No |
| 9 | Cd38 | 2104 | 0.340 | 0.1391 | No |
| 10 | Tnfrsf21 | 2137 | 0.338 | 0.1580 | No |
| 11 | Ltbr | 2914 | 0.283 | 0.1349 | No |
| 12 | Cxcl10 | 3511 | 0.246 | 0.1189 | No |
| 13 | Dntt | 4196 | 0.209 | 0.0960 | No |
| 14 | Pf4 | 4483 | 0.195 | 0.0930 | No |
| 15 | Bak1 | 5382 | 0.153 | 0.0556 | No |
| 16 | Grb2 | 5413 | 0.151 | 0.0633 | No |
| 17 | Crlf2 | 5592 | 0.144 | 0.0628 | No |
| 18 | Tyk2 | 5657 | 0.142 | 0.0681 | No |
| 19 | Cd9 | 6093 | 0.124 | 0.0530 | No |
| 20 | Tnfrsf1a | 6125 | 0.122 | 0.0589 | No |
| 21 | Il13ra1 | 6187 | 0.120 | 0.0630 | No |
| 22 | Stam2 | 6236 | 0.119 | 0.0678 | No |
| 23 | Il7 | 6636 | 0.103 | 0.0533 | No |
| 24 | Ptpn11 | 6754 | 0.099 | 0.0533 | No |
| 25 | Jun | 7239 | 0.081 | 0.0330 | No |
| 26 | Fas | 7275 | 0.079 | 0.0360 | No |
| 27 | Socs1 | 8426 | 0.040 | -0.0213 | No |
| 28 | Csf3r | 8783 | 0.028 | -0.0380 | No |
| 29 | Ptpn2 | 8994 | 0.021 | -0.0477 | No |
| 30 | Il12rb1 | 9683 | -0.001 | -0.0834 | No |
| 31 | Tgfb1 | 9845 | -0.006 | -0.0914 | No |
| 32 | Il17ra | 10011 | -0.012 | -0.0992 | No |
| 33 | Stat1 | 10203 | -0.019 | -0.1080 | No |
| 34 | Itga4 | 10450 | -0.027 | -0.1192 | No |
| 35 | Map3k8 | 10577 | -0.031 | -0.1238 | No |
| 36 | Ptpn1 | 10951 | -0.043 | -0.1406 | No |
| 37 | Pdgfc | 11085 | -0.048 | -0.1446 | No |
| 38 | Ltb | 11248 | -0.054 | -0.1498 | No |
| 39 | Socs3 | 11463 | -0.062 | -0.1571 | No |
| 40 | Ifnar1 | 11553 | -0.065 | -0.1578 | No |
| 41 | Cbl | 12091 | -0.085 | -0.1805 | No |
| 42 | Csf1 | 12129 | -0.087 | -0.1772 | No |
| 43 | Itgb3 | 12496 | -0.099 | -0.1901 | No |
| 44 | Il15ra | 12622 | -0.105 | -0.1902 | No |
| 45 | Cd44 | 12726 | -0.109 | -0.1889 | No |
| 46 | Pik3r5 | 12738 | -0.110 | -0.1828 | No |
| 47 | Il1r1 | 12884 | -0.114 | -0.1834 | No |
| 48 | Hax1 | 12979 | -0.118 | -0.1811 | No |
| 49 | Lepr | 13018 | -0.119 | -0.1758 | No |
| 50 | Il18r1 | 13248 | -0.127 | -0.1800 | No |
| 51 | Ifngr2 | 14296 | -0.171 | -0.2240 | No |
| 52 | Tnfrsf1b | 14900 | -0.199 | -0.2432 | No |
| 53 | Stat2 | 16112 | -0.265 | -0.2900 | Yes |
| 54 | Il2rg | 16122 | -0.266 | -0.2743 | Yes |
| 55 | Ebi3 | 16216 | -0.272 | -0.2626 | Yes |
| 56 | Ifngr1 | 16931 | -0.321 | -0.2802 | Yes |
| 57 | Il6st | 17027 | -0.328 | -0.2652 | Yes |
| 58 | Tlr2 | 17030 | -0.328 | -0.2453 | Yes |
| 59 | Stat3 | 17440 | -0.363 | -0.2445 | Yes |
| 60 | Pim1 | 17541 | -0.370 | -0.2271 | Yes |
| 61 | Il4ra | 17887 | -0.404 | -0.2204 | Yes |
| 62 | Il1r2 | 17968 | -0.412 | -0.1995 | Yes |
| 63 | Irf1 | 18157 | -0.434 | -0.1829 | Yes |
| 64 | Acvr1b | 18351 | -0.461 | -0.1649 | Yes |
| 65 | Myd88 | 18515 | -0.490 | -0.1435 | Yes |
| 66 | Irf9 | 19108 | -0.673 | -0.1333 | Yes |
| 67 | Il1b | 19189 | -0.746 | -0.0921 | Yes |
| 68 | Il6 | 19208 | -0.767 | -0.0463 | Yes |
| 69 | Tnfrsf12a | 19255 | -0.844 | 0.0027 | Yes |