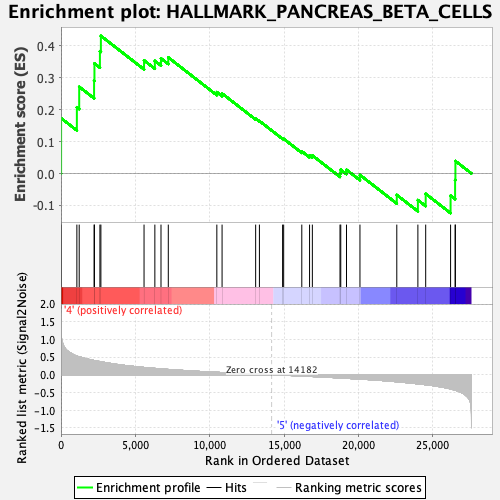
Profile of the Running ES Score & Positions of GeneSet Members on the Rank Ordered List
| Dataset | MEP.MEP.ery_Pheno.cls #Group6_versus_Group8.MEP.ery_Pheno.cls #Group6_versus_Group8_repos |
| Phenotype | MEP.ery_Pheno.cls#Group6_versus_Group8_repos |
| Upregulated in class | 4 |
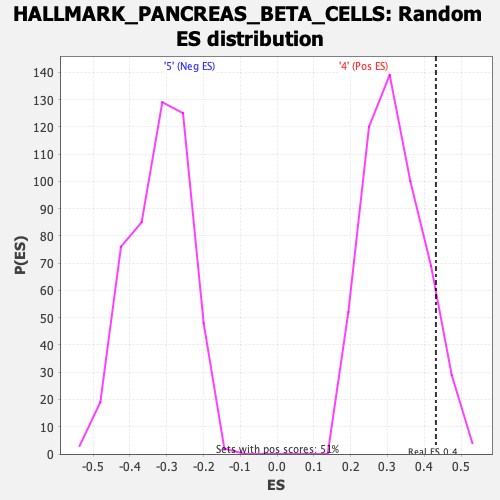
| GeneSet | HALLMARK_PANCREAS_BETA_CELLS |
| Enrichment Score (ES) | 0.4316735 |
| Normalized Enrichment Score (NES) | 1.3495536 |
| Nominal p-value | 0.099415205 |
| FDR q-value | 1.0 |
| FWER p-Value | 0.693 |
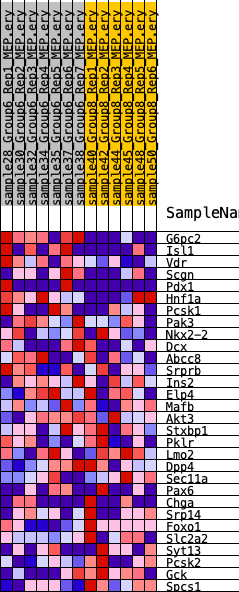
| SYMBOL | RANK IN GENE LIST | RANK METRIC SCORE | RUNNING ES | CORE ENRICHMENT | |
|---|---|---|---|---|---|
| 1 | G6pc2 | 7 | 1.261 | 0.1735 | Yes |
| 2 | Isl1 | 1067 | 0.527 | 0.2077 | Yes |
| 3 | Vdr | 1224 | 0.508 | 0.2720 | Yes |
| 4 | Scgn | 2225 | 0.402 | 0.2911 | Yes |
| 5 | Pdx1 | 2249 | 0.400 | 0.3453 | Yes |
| 6 | Hnf1a | 2617 | 0.373 | 0.3834 | Yes |
| 7 | Pcsk1 | 2682 | 0.367 | 0.4317 | Yes |
| 8 | Pak3 | 5584 | 0.206 | 0.3549 | No |
| 9 | Nkx2-2 | 6311 | 0.179 | 0.3533 | No |
| 10 | Dcx | 6724 | 0.166 | 0.3611 | No |
| 11 | Abcc8 | 7215 | 0.150 | 0.3640 | No |
| 12 | Srprb | 10479 | 0.069 | 0.2552 | No |
| 13 | Ins2 | 10831 | 0.062 | 0.2510 | No |
| 14 | Elp4 | 13089 | 0.020 | 0.1718 | No |
| 15 | Mafb | 13342 | 0.015 | 0.1648 | No |
| 16 | Akt3 | 14901 | -0.011 | 0.1098 | No |
| 17 | Stxbp1 | 14973 | -0.012 | 0.1088 | No |
| 18 | Pklr | 16192 | -0.035 | 0.0695 | No |
| 19 | Lmo2 | 16714 | -0.045 | 0.0567 | No |
| 20 | Dpp4 | 16902 | -0.048 | 0.0566 | No |
| 21 | Sec11a | 18761 | -0.089 | 0.0015 | No |
| 22 | Pax6 | 18812 | -0.090 | 0.0120 | No |
| 23 | Chga | 19198 | -0.099 | 0.0117 | No |
| 24 | Srp14 | 20103 | -0.120 | -0.0045 | No |
| 25 | Foxo1 | 22580 | -0.197 | -0.0672 | No |
| 26 | Slc2a2 | 23998 | -0.256 | -0.0833 | No |
| 27 | Syt13 | 24523 | -0.281 | -0.0636 | No |
| 28 | Pcsk2 | 26197 | -0.398 | -0.0694 | No |
| 29 | Gck | 26501 | -0.436 | -0.0204 | No |
| 30 | Spcs1 | 26522 | -0.438 | 0.0392 | No |