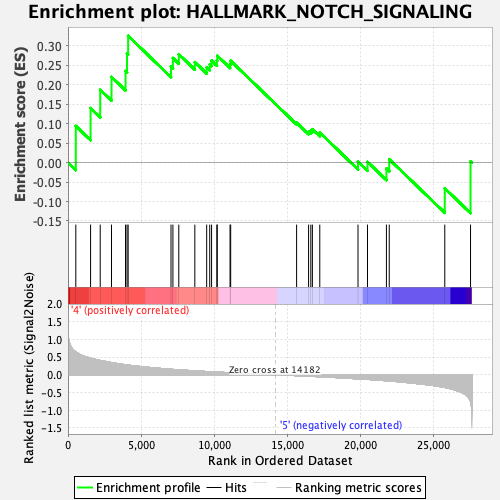
Profile of the Running ES Score & Positions of GeneSet Members on the Rank Ordered List
| Dataset | MEP.MEP.ery_Pheno.cls #Group6_versus_Group8.MEP.ery_Pheno.cls #Group6_versus_Group8_repos |
| Phenotype | MEP.ery_Pheno.cls#Group6_versus_Group8_repos |
| Upregulated in class | 4 |
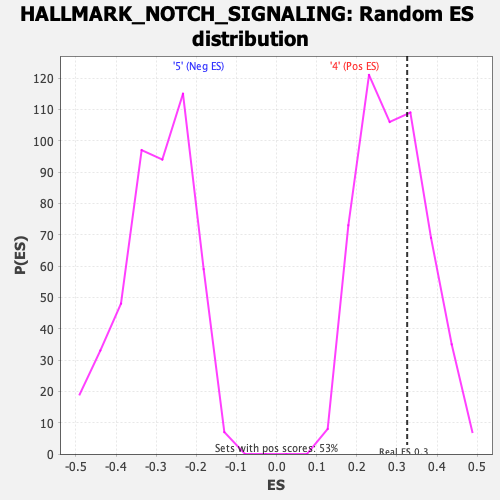
| GeneSet | HALLMARK_NOTCH_SIGNALING |
| Enrichment Score (ES) | 0.32551995 |
| Normalized Enrichment Score (NES) | 1.1223662 |
| Nominal p-value | 0.3219697 |
| FDR q-value | 0.79923207 |
| FWER p-Value | 0.913 |
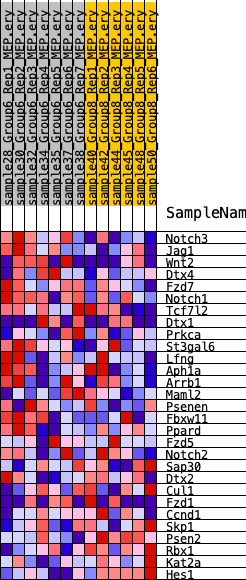
| SYMBOL | RANK IN GENE LIST | RANK METRIC SCORE | RUNNING ES | CORE ENRICHMENT | |
|---|---|---|---|---|---|
| 1 | Notch3 | 534 | 0.644 | 0.0941 | Yes |
| 2 | Jag1 | 1544 | 0.469 | 0.1400 | Yes |
| 3 | Wnt2 | 2202 | 0.404 | 0.1872 | Yes |
| 4 | Dtx4 | 2974 | 0.345 | 0.2200 | Yes |
| 5 | Fzd7 | 3932 | 0.283 | 0.2351 | Yes |
| 6 | Notch1 | 4034 | 0.277 | 0.2803 | Yes |
| 7 | Tcf7l2 | 4111 | 0.273 | 0.3255 | Yes |
| 8 | Dtx1 | 7040 | 0.156 | 0.2467 | No |
| 9 | Prkca | 7171 | 0.151 | 0.2686 | No |
| 10 | St3gal6 | 7573 | 0.138 | 0.2784 | No |
| 11 | Lfng | 8669 | 0.110 | 0.2580 | No |
| 12 | Aph1a | 9479 | 0.090 | 0.2445 | No |
| 13 | Arrb1 | 9688 | 0.086 | 0.2521 | No |
| 14 | Maml2 | 9814 | 0.083 | 0.2622 | No |
| 15 | Psenen | 10175 | 0.075 | 0.2624 | No |
| 16 | Fbxw11 | 10202 | 0.075 | 0.2746 | No |
| 17 | Ppard | 11076 | 0.058 | 0.2530 | No |
| 18 | Fzd5 | 11120 | 0.057 | 0.2615 | No |
| 19 | Notch2 | 15626 | -0.024 | 0.1024 | No |
| 20 | Sap30 | 16445 | -0.039 | 0.0796 | No |
| 21 | Dtx2 | 16598 | -0.043 | 0.0817 | No |
| 22 | Cul1 | 16705 | -0.045 | 0.0857 | No |
| 23 | Fzd1 | 17210 | -0.055 | 0.0771 | No |
| 24 | Ccnd1 | 19823 | -0.115 | 0.0025 | No |
| 25 | Skp1 | 20471 | -0.130 | 0.0019 | No |
| 26 | Psen2 | 21765 | -0.169 | -0.0153 | No |
| 27 | Rbx1 | 21958 | -0.175 | 0.0086 | No |
| 28 | Kat2a | 25754 | -0.358 | -0.0660 | No |
| 29 | Hes1 | 27515 | -0.756 | 0.0032 | No |