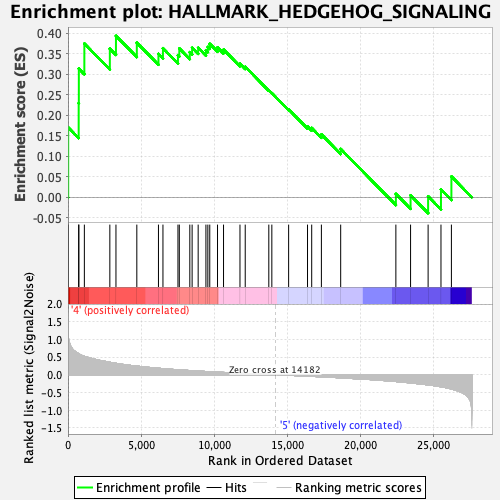
Profile of the Running ES Score & Positions of GeneSet Members on the Rank Ordered List
| Dataset | MEP.MEP.ery_Pheno.cls #Group6_versus_Group8.MEP.ery_Pheno.cls #Group6_versus_Group8_repos |
| Phenotype | MEP.ery_Pheno.cls#Group6_versus_Group8_repos |
| Upregulated in class | 4 |
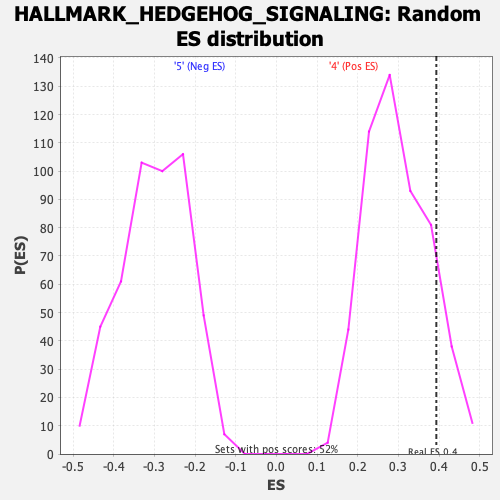
| GeneSet | HALLMARK_HEDGEHOG_SIGNALING |
| Enrichment Score (ES) | 0.39331347 |
| Normalized Enrichment Score (NES) | 1.3203607 |
| Nominal p-value | 0.12524085 |
| FDR q-value | 0.9621691 |
| FWER p-Value | 0.733 |
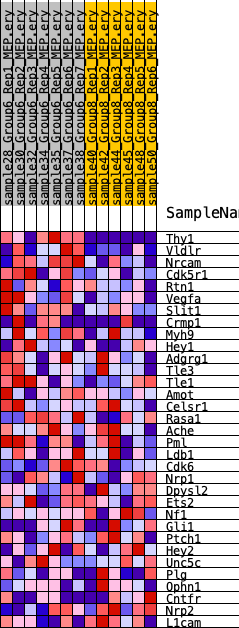
| SYMBOL | RANK IN GENE LIST | RANK METRIC SCORE | RUNNING ES | CORE ENRICHMENT | |
|---|---|---|---|---|---|
| 1 | Thy1 | 13 | 1.189 | 0.1702 | Yes |
| 2 | Vldlr | 730 | 0.592 | 0.2293 | Yes |
| 3 | Nrcam | 741 | 0.589 | 0.3136 | Yes |
| 4 | Cdk5r1 | 1118 | 0.520 | 0.3746 | Yes |
| 5 | Rtn1 | 2860 | 0.352 | 0.3620 | Yes |
| 6 | Vegfa | 3278 | 0.323 | 0.3933 | Yes |
| 7 | Slit1 | 4704 | 0.244 | 0.3766 | No |
| 8 | Crmp1 | 6183 | 0.184 | 0.3495 | No |
| 9 | Myh9 | 6490 | 0.173 | 0.3632 | No |
| 10 | Hey1 | 7516 | 0.140 | 0.3462 | No |
| 11 | Adgrg1 | 7608 | 0.137 | 0.3626 | No |
| 12 | Tle3 | 8326 | 0.119 | 0.3536 | No |
| 13 | Tle1 | 8484 | 0.114 | 0.3644 | No |
| 14 | Amot | 8897 | 0.104 | 0.3643 | No |
| 15 | Celsr1 | 9427 | 0.091 | 0.3583 | No |
| 16 | Rasa1 | 9559 | 0.089 | 0.3663 | No |
| 17 | Ache | 9690 | 0.086 | 0.3739 | No |
| 18 | Pml | 10220 | 0.074 | 0.3653 | No |
| 19 | Ldb1 | 10631 | 0.066 | 0.3599 | No |
| 20 | Cdk6 | 11755 | 0.044 | 0.3256 | No |
| 21 | Nrp1 | 12114 | 0.038 | 0.3180 | No |
| 22 | Dpysl2 | 13726 | 0.008 | 0.2607 | No |
| 23 | Ets2 | 13933 | 0.004 | 0.2539 | No |
| 24 | Nf1 | 15081 | -0.014 | 0.2142 | No |
| 25 | Gli1 | 16372 | -0.038 | 0.1729 | No |
| 26 | Ptch1 | 16658 | -0.044 | 0.1689 | No |
| 27 | Hey2 | 17320 | -0.057 | 0.1531 | No |
| 28 | Unc5c | 18639 | -0.086 | 0.1177 | No |
| 29 | Plg | 22411 | -0.190 | 0.0082 | No |
| 30 | Ophn1 | 23416 | -0.230 | 0.0048 | No |
| 31 | Cntfr | 24615 | -0.285 | 0.0023 | No |
| 32 | Nrp2 | 25494 | -0.339 | 0.0191 | No |
| 33 | L1cam | 26207 | -0.399 | 0.0506 | No |