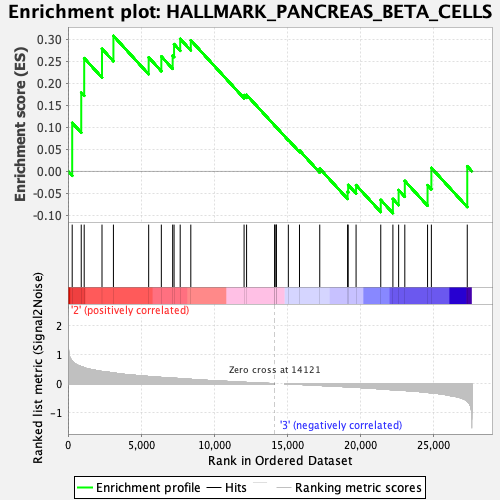
Profile of the Running ES Score & Positions of GeneSet Members on the Rank Ordered List
| Dataset | MEP.MEP.ery_Pheno.cls #Group3_versus_Group4.MEP.ery_Pheno.cls #Group3_versus_Group4_repos |
| Phenotype | MEP.ery_Pheno.cls#Group3_versus_Group4_repos |
| Upregulated in class | 2 |
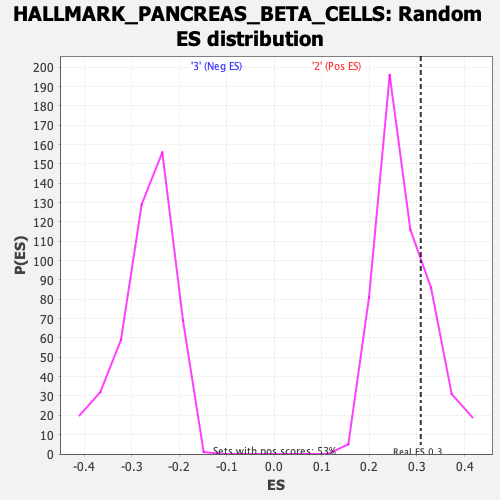
| GeneSet | HALLMARK_PANCREAS_BETA_CELLS |
| Enrichment Score (ES) | 0.30792716 |
| Normalized Enrichment Score (NES) | 1.1300167 |
| Nominal p-value | 0.25468165 |
| FDR q-value | 1.0 |
| FWER p-Value | 0.986 |
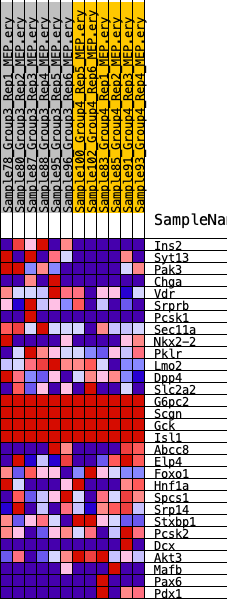
| SYMBOL | RANK IN GENE LIST | RANK METRIC SCORE | RUNNING ES | CORE ENRICHMENT | |
|---|---|---|---|---|---|
| 1 | Ins2 | 287 | 0.775 | 0.1100 | Yes |
| 2 | Syt13 | 905 | 0.587 | 0.1789 | Yes |
| 3 | Pak3 | 1107 | 0.550 | 0.2572 | Yes |
| 4 | Chga | 2324 | 0.421 | 0.2785 | Yes |
| 5 | Vdr | 3105 | 0.371 | 0.3079 | Yes |
| 6 | Srprb | 5514 | 0.247 | 0.2589 | No |
| 7 | Pcsk1 | 6380 | 0.216 | 0.2611 | No |
| 8 | Sec11a | 7154 | 0.193 | 0.2631 | No |
| 9 | Nkx2-2 | 7250 | 0.189 | 0.2891 | No |
| 10 | Pklr | 7669 | 0.174 | 0.3010 | No |
| 11 | Lmo2 | 8394 | 0.148 | 0.2979 | No |
| 12 | Dpp4 | 12036 | 0.047 | 0.1731 | No |
| 13 | Slc2a2 | 12207 | 0.043 | 0.1736 | No |
| 14 | G6pc2 | 14125 | 0.000 | 0.1041 | No |
| 15 | Scgn | 14143 | 0.000 | 0.1035 | No |
| 16 | Gck | 14236 | 0.000 | 0.1001 | No |
| 17 | Isl1 | 14238 | 0.000 | 0.1001 | No |
| 18 | Abcc8 | 15061 | -0.006 | 0.0712 | No |
| 19 | Elp4 | 15823 | -0.023 | 0.0471 | No |
| 20 | Foxo1 | 17208 | -0.058 | 0.0060 | No |
| 21 | Hnf1a | 19111 | -0.106 | -0.0465 | No |
| 22 | Spcs1 | 19151 | -0.107 | -0.0313 | No |
| 23 | Srp14 | 19691 | -0.123 | -0.0317 | No |
| 24 | Stxbp1 | 21378 | -0.177 | -0.0653 | No |
| 25 | Pcsk2 | 22208 | -0.208 | -0.0631 | No |
| 26 | Dcx | 22600 | -0.221 | -0.0429 | No |
| 27 | Akt3 | 23022 | -0.232 | -0.0221 | No |
| 28 | Mafb | 24577 | -0.300 | -0.0318 | No |
| 29 | Pax6 | 24838 | -0.314 | 0.0075 | No |
| 30 | Pdx1 | 27291 | -0.596 | 0.0113 | No |