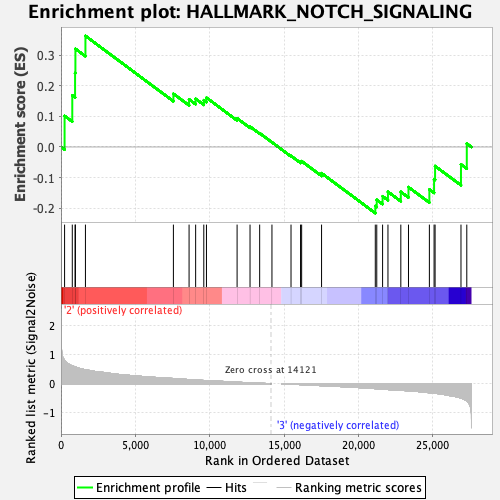
Profile of the Running ES Score & Positions of GeneSet Members on the Rank Ordered List
| Dataset | MEP.MEP.ery_Pheno.cls #Group3_versus_Group4.MEP.ery_Pheno.cls #Group3_versus_Group4_repos |
| Phenotype | MEP.ery_Pheno.cls#Group3_versus_Group4_repos |
| Upregulated in class | 2 |
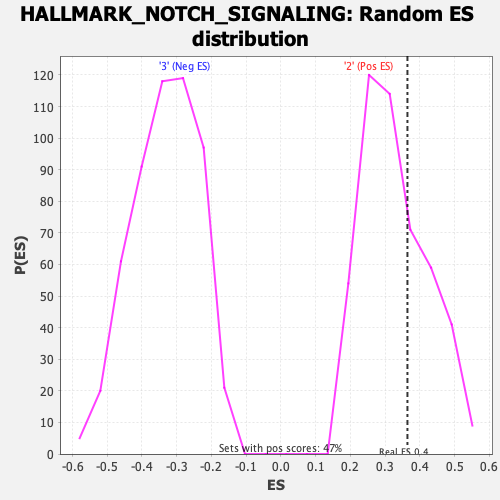
| GeneSet | HALLMARK_NOTCH_SIGNALING |
| Enrichment Score (ES) | 0.36418003 |
| Normalized Enrichment Score (NES) | 1.1084406 |
| Nominal p-value | 0.31623933 |
| FDR q-value | 1.0 |
| FWER p-Value | 0.991 |
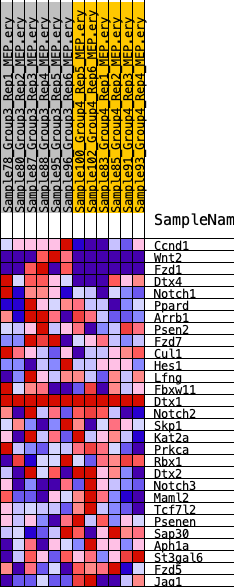
| SYMBOL | RANK IN GENE LIST | RANK METRIC SCORE | RUNNING ES | CORE ENRICHMENT | |
|---|---|---|---|---|---|
| 1 | Ccnd1 | 241 | 0.797 | 0.1019 | Yes |
| 2 | Wnt2 | 759 | 0.618 | 0.1691 | Yes |
| 3 | Fzd1 | 947 | 0.578 | 0.2426 | Yes |
| 4 | Dtx4 | 969 | 0.576 | 0.3217 | Yes |
| 5 | Notch1 | 1643 | 0.481 | 0.3642 | Yes |
| 6 | Ppard | 7558 | 0.179 | 0.1746 | No |
| 7 | Arrb1 | 8612 | 0.142 | 0.1561 | No |
| 8 | Psen2 | 9054 | 0.128 | 0.1578 | No |
| 9 | Fzd7 | 9602 | 0.111 | 0.1533 | No |
| 10 | Cul1 | 9781 | 0.106 | 0.1616 | No |
| 11 | Hes1 | 11841 | 0.052 | 0.0941 | No |
| 12 | Lfng | 12711 | 0.030 | 0.0667 | No |
| 13 | Fbxw11 | 13359 | 0.014 | 0.0453 | No |
| 14 | Dtx1 | 14185 | 0.000 | 0.0154 | No |
| 15 | Notch2 | 15467 | -0.014 | -0.0291 | No |
| 16 | Skp1 | 16108 | -0.030 | -0.0482 | No |
| 17 | Kat2a | 16182 | -0.032 | -0.0464 | No |
| 18 | Prkca | 17521 | -0.066 | -0.0858 | No |
| 19 | Rbx1 | 21134 | -0.169 | -0.1934 | No |
| 20 | Dtx2 | 21233 | -0.171 | -0.1731 | No |
| 21 | Notch3 | 21625 | -0.186 | -0.1615 | No |
| 22 | Maml2 | 21986 | -0.201 | -0.1467 | No |
| 23 | Tcf7l2 | 22851 | -0.224 | -0.1470 | No |
| 24 | Psenen | 23366 | -0.246 | -0.1314 | No |
| 25 | Sap30 | 24771 | -0.310 | -0.1392 | No |
| 26 | Aph1a | 25087 | -0.324 | -0.1056 | No |
| 27 | St3gal6 | 25155 | -0.329 | -0.0624 | No |
| 28 | Fzd5 | 26896 | -0.494 | -0.0569 | No |
| 29 | Jag1 | 27287 | -0.594 | 0.0114 | No |