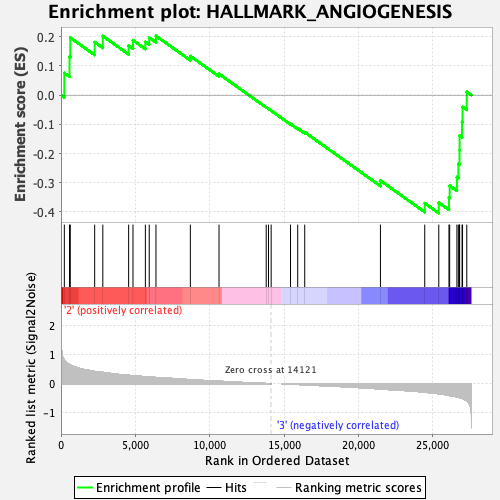
Profile of the Running ES Score & Positions of GeneSet Members on the Rank Ordered List
| Dataset | MEP.MEP.ery_Pheno.cls #Group3_versus_Group4.MEP.ery_Pheno.cls #Group3_versus_Group4_repos |
| Phenotype | MEP.ery_Pheno.cls#Group3_versus_Group4_repos |
| Upregulated in class | 3 |
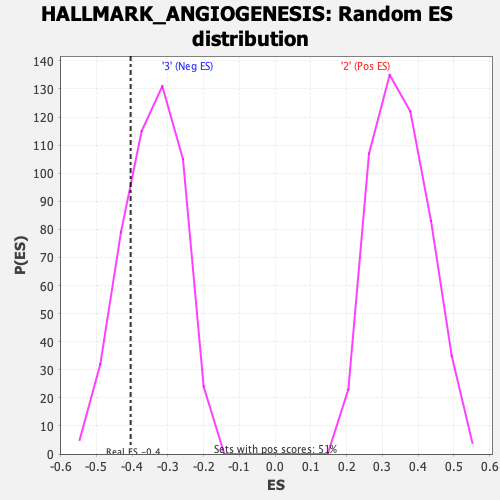
| GeneSet | HALLMARK_ANGIOGENESIS |
| Enrichment Score (ES) | -0.4045462 |
| Normalized Enrichment Score (NES) | -1.1701064 |
| Nominal p-value | 0.23217922 |
| FDR q-value | 1.0 |
| FWER p-Value | 0.963 |
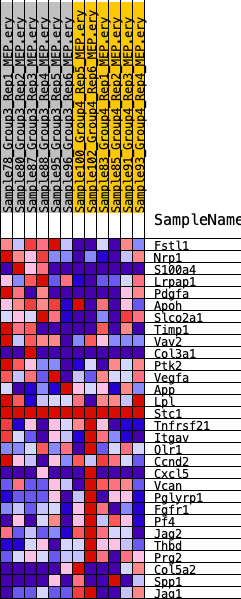
| SYMBOL | RANK IN GENE LIST | RANK METRIC SCORE | RUNNING ES | CORE ENRICHMENT | |
|---|---|---|---|---|---|
| 1 | Fstl1 | 224 | 0.810 | 0.0760 | No |
| 2 | Nrp1 | 572 | 0.662 | 0.1322 | No |
| 3 | S100a4 | 624 | 0.644 | 0.1972 | No |
| 4 | Lrpap1 | 2264 | 0.424 | 0.1818 | No |
| 5 | Pdgfa | 2812 | 0.393 | 0.2028 | No |
| 6 | Apoh | 4548 | 0.291 | 0.1701 | No |
| 7 | Slco2a1 | 4840 | 0.276 | 0.1883 | No |
| 8 | Timp1 | 5673 | 0.240 | 0.1830 | No |
| 9 | Vav2 | 5934 | 0.228 | 0.1973 | No |
| 10 | Col3a1 | 6386 | 0.216 | 0.2033 | No |
| 11 | Ptk2 | 8698 | 0.139 | 0.1340 | No |
| 12 | Vegfa | 10626 | 0.084 | 0.0728 | No |
| 13 | App | 13799 | 0.007 | -0.0415 | No |
| 14 | Lpl | 13952 | 0.004 | -0.0466 | No |
| 15 | Stc1 | 14132 | 0.000 | -0.0531 | No |
| 16 | Tnfrsf21 | 15433 | -0.013 | -0.0989 | No |
| 17 | Itgav | 15917 | -0.025 | -0.1138 | No |
| 18 | Olr1 | 16389 | -0.037 | -0.1270 | No |
| 19 | Ccnd2 | 21480 | -0.181 | -0.2928 | No |
| 20 | Cxcl5 | 24459 | -0.293 | -0.3703 | Yes |
| 21 | Vcan | 25403 | -0.347 | -0.3685 | Yes |
| 22 | Pglyrp1 | 26088 | -0.405 | -0.3513 | Yes |
| 23 | Fgfr1 | 26136 | -0.411 | -0.3102 | Yes |
| 24 | Pf4 | 26623 | -0.454 | -0.2807 | Yes |
| 25 | Jag2 | 26721 | -0.466 | -0.2358 | Yes |
| 26 | Thbd | 26799 | -0.479 | -0.1888 | Yes |
| 27 | Prg2 | 26803 | -0.480 | -0.1390 | Yes |
| 28 | Col5a2 | 26969 | -0.507 | -0.0923 | Yes |
| 29 | Spp1 | 27001 | -0.515 | -0.0400 | Yes |
| 30 | Jag1 | 27287 | -0.594 | 0.0114 | Yes |