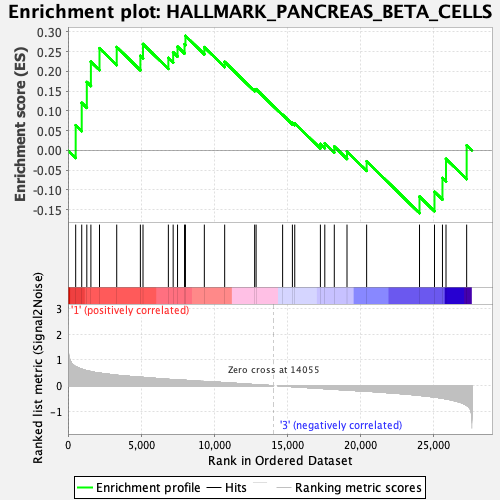
Profile of the Running ES Score & Positions of GeneSet Members on the Rank Ordered List
| Dataset | MEP.MEP.ery_Pheno.cls #Group2_versus_Group4.MEP.ery_Pheno.cls #Group2_versus_Group4_repos |
| Phenotype | MEP.ery_Pheno.cls#Group2_versus_Group4_repos |
| Upregulated in class | 1 |
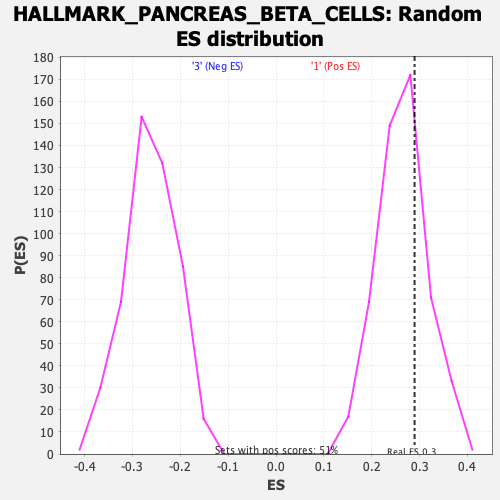
| GeneSet | HALLMARK_PANCREAS_BETA_CELLS |
| Enrichment Score (ES) | 0.2894886 |
| Normalized Enrichment Score (NES) | 1.0893792 |
| Nominal p-value | 0.28460038 |
| FDR q-value | 0.69240296 |
| FWER p-Value | 0.972 |
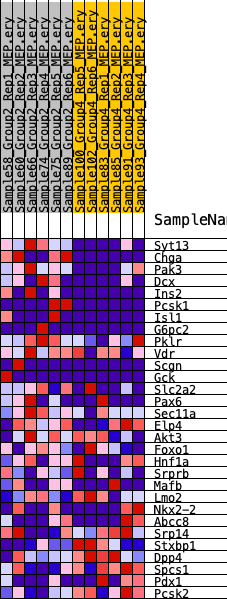
| SYMBOL | RANK IN GENE LIST | RANK METRIC SCORE | RUNNING ES | CORE ENRICHMENT | |
|---|---|---|---|---|---|
| 1 | Syt13 | 525 | 0.734 | 0.0636 | Yes |
| 2 | Chga | 938 | 0.636 | 0.1202 | Yes |
| 3 | Pak3 | 1286 | 0.579 | 0.1728 | Yes |
| 4 | Dcx | 1565 | 0.546 | 0.2242 | Yes |
| 5 | Ins2 | 2153 | 0.492 | 0.2582 | Yes |
| 6 | Pcsk1 | 3330 | 0.405 | 0.2612 | Yes |
| 7 | Isl1 | 4947 | 0.326 | 0.2392 | Yes |
| 8 | G6pc2 | 5127 | 0.321 | 0.2689 | Yes |
| 9 | Pklr | 6860 | 0.246 | 0.2337 | Yes |
| 10 | Vdr | 7188 | 0.232 | 0.2480 | Yes |
| 11 | Scgn | 7487 | 0.223 | 0.2622 | Yes |
| 12 | Gck | 7965 | 0.208 | 0.2684 | Yes |
| 13 | Slc2a2 | 8028 | 0.208 | 0.2895 | Yes |
| 14 | Pax6 | 9319 | 0.162 | 0.2609 | No |
| 15 | Sec11a | 10709 | 0.117 | 0.2237 | No |
| 16 | Elp4 | 12758 | 0.041 | 0.1540 | No |
| 17 | Akt3 | 12857 | 0.037 | 0.1547 | No |
| 18 | Foxo1 | 14670 | -0.010 | 0.0900 | No |
| 19 | Hnf1a | 15339 | -0.034 | 0.0696 | No |
| 20 | Srprb | 15499 | -0.040 | 0.0684 | No |
| 21 | Mafb | 17252 | -0.102 | 0.0164 | No |
| 22 | Lmo2 | 17553 | -0.112 | 0.0181 | No |
| 23 | Nkx2-2 | 18202 | -0.136 | 0.0098 | No |
| 24 | Abcc8 | 19071 | -0.166 | -0.0030 | No |
| 25 | Srp14 | 20413 | -0.215 | -0.0275 | No |
| 26 | Stxbp1 | 24027 | -0.373 | -0.1166 | No |
| 27 | Dpp4 | 25051 | -0.436 | -0.1046 | No |
| 28 | Spcs1 | 25596 | -0.484 | -0.0698 | No |
| 29 | Pdx1 | 25838 | -0.509 | -0.0213 | No |
| 30 | Pcsk2 | 27250 | -0.758 | 0.0128 | No |