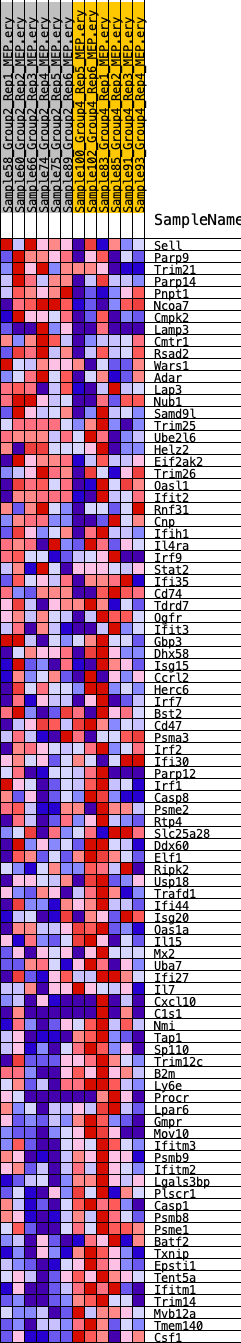
Profile of the Running ES Score & Positions of GeneSet Members on the Rank Ordered List
| Dataset | MEP.MEP.ery_Pheno.cls #Group2_versus_Group4.MEP.ery_Pheno.cls #Group2_versus_Group4_repos |
| Phenotype | MEP.ery_Pheno.cls#Group2_versus_Group4_repos |
| Upregulated in class | 3 |
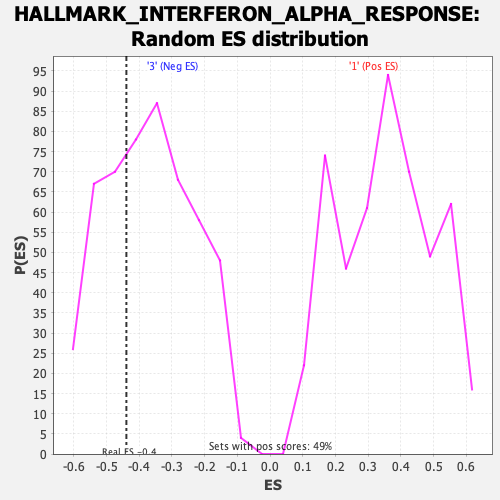
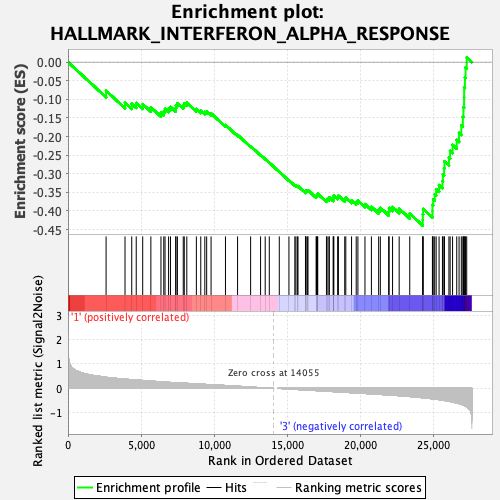
| GeneSet | HALLMARK_INTERFERON_ALPHA_RESPONSE |
| Enrichment Score (ES) | -0.4394548 |
| Normalized Enrichment Score (NES) | -1.1912923 |
| Nominal p-value | 0.3339921 |
| FDR q-value | 0.84661925 |
| FWER p-Value | 0.928 |
| SYMBOL | RANK IN GENE LIST | RANK METRIC SCORE | RUNNING ES | CORE ENRICHMENT | |
|---|---|---|---|---|---|
| 1 | Sell | 2603 | 0.449 | -0.0769 | No |
| 2 | Parp9 | 3897 | 0.376 | -0.1092 | No |
| 3 | Trim21 | 4357 | 0.352 | -0.1120 | No |
| 4 | Parp14 | 4664 | 0.340 | -0.1097 | No |
| 5 | Pnpt1 | 5106 | 0.322 | -0.1131 | No |
| 6 | Ncoa7 | 5664 | 0.297 | -0.1216 | No |
| 7 | Cmpk2 | 6354 | 0.270 | -0.1360 | No |
| 8 | Lamp3 | 6547 | 0.261 | -0.1328 | No |
| 9 | Cmtr1 | 6632 | 0.256 | -0.1257 | No |
| 10 | Rsad2 | 6875 | 0.245 | -0.1249 | No |
| 11 | Wars1 | 7004 | 0.239 | -0.1201 | No |
| 12 | Adar | 7360 | 0.228 | -0.1240 | No |
| 13 | Lap3 | 7381 | 0.227 | -0.1158 | No |
| 14 | Nub1 | 7479 | 0.223 | -0.1106 | No |
| 15 | Samd9l | 7877 | 0.211 | -0.1167 | No |
| 16 | Trim25 | 7948 | 0.209 | -0.1111 | No |
| 17 | Ube2l6 | 8120 | 0.204 | -0.1093 | No |
| 18 | Helz2 | 8774 | 0.178 | -0.1260 | No |
| 19 | Eif2ak2 | 9075 | 0.165 | -0.1304 | No |
| 20 | Trim26 | 9352 | 0.161 | -0.1341 | No |
| 21 | Oasl1 | 9478 | 0.156 | -0.1325 | No |
| 22 | Ifit2 | 9779 | 0.144 | -0.1377 | No |
| 23 | Rnf31 | 10763 | 0.115 | -0.1689 | No |
| 24 | Cnp | 11591 | 0.085 | -0.1956 | No |
| 25 | Ifih1 | 12483 | 0.051 | -0.2260 | No |
| 26 | Il4ra | 13164 | 0.027 | -0.2497 | No |
| 27 | Irf9 | 13479 | 0.017 | -0.2604 | No |
| 28 | Stat2 | 13759 | 0.008 | -0.2703 | No |
| 29 | Ifi35 | 14442 | -0.003 | -0.2949 | No |
| 30 | Cd74 | 15101 | -0.025 | -0.3179 | No |
| 31 | Tdrd7 | 15505 | -0.041 | -0.3309 | No |
| 32 | Ogfr | 15577 | -0.043 | -0.3318 | No |
| 33 | Ifit3 | 15678 | -0.047 | -0.3336 | No |
| 34 | Gbp3 | 15721 | -0.048 | -0.3332 | No |
| 35 | Dhx58 | 16232 | -0.065 | -0.3492 | No |
| 36 | Isg15 | 16241 | -0.066 | -0.3469 | No |
| 37 | Ccrl2 | 16273 | -0.067 | -0.3454 | No |
| 38 | Herc6 | 16360 | -0.070 | -0.3457 | No |
| 39 | Irf7 | 16405 | -0.072 | -0.3445 | No |
| 40 | Bst2 | 16960 | -0.091 | -0.3611 | No |
| 41 | Cd47 | 16987 | -0.092 | -0.3584 | No |
| 42 | Psma3 | 17056 | -0.094 | -0.3572 | No |
| 43 | Irf2 | 17069 | -0.095 | -0.3539 | No |
| 44 | Ifi30 | 17666 | -0.116 | -0.3710 | No |
| 45 | Parp12 | 17710 | -0.118 | -0.3679 | No |
| 46 | Irf1 | 17838 | -0.122 | -0.3677 | No |
| 47 | Casp8 | 17859 | -0.123 | -0.3636 | No |
| 48 | Psme2 | 18128 | -0.132 | -0.3682 | No |
| 49 | Rtp4 | 18141 | -0.133 | -0.3634 | No |
| 50 | Slc25a28 | 18171 | -0.134 | -0.3591 | No |
| 51 | Ddx60 | 18432 | -0.144 | -0.3629 | No |
| 52 | Elf1 | 18483 | -0.146 | -0.3590 | No |
| 53 | Ripk2 | 18916 | -0.161 | -0.3683 | No |
| 54 | Usp18 | 18988 | -0.163 | -0.3645 | No |
| 55 | Trafd1 | 19382 | -0.178 | -0.3718 | No |
| 56 | Ifi44 | 19700 | -0.189 | -0.3759 | No |
| 57 | Isg20 | 19816 | -0.193 | -0.3725 | No |
| 58 | Oas1a | 20299 | -0.211 | -0.3817 | No |
| 59 | Il15 | 20739 | -0.222 | -0.3889 | No |
| 60 | Mx2 | 21235 | -0.243 | -0.3973 | No |
| 61 | Uba7 | 21349 | -0.249 | -0.3917 | No |
| 62 | Ifi27 | 21919 | -0.270 | -0.4017 | No |
| 63 | Il7 | 21949 | -0.271 | -0.3921 | No |
| 64 | Cxcl10 | 22185 | -0.282 | -0.3895 | No |
| 65 | C1s1 | 22636 | -0.300 | -0.3941 | No |
| 66 | Nmi | 23360 | -0.335 | -0.4072 | No |
| 67 | Tap1 | 24249 | -0.386 | -0.4243 | Yes |
| 68 | Sp110 | 24253 | -0.386 | -0.4092 | Yes |
| 69 | Trim12c | 24275 | -0.387 | -0.3947 | Yes |
| 70 | B2m | 24911 | -0.427 | -0.4010 | Yes |
| 71 | Ly6e | 24913 | -0.427 | -0.3842 | Yes |
| 72 | Procr | 24963 | -0.430 | -0.3691 | Yes |
| 73 | Lpar6 | 25064 | -0.438 | -0.3555 | Yes |
| 74 | Gmpr | 25165 | -0.446 | -0.3415 | Yes |
| 75 | Mov10 | 25364 | -0.463 | -0.3305 | Yes |
| 76 | Ifitm3 | 25594 | -0.484 | -0.3198 | Yes |
| 77 | Psmb9 | 25627 | -0.487 | -0.3018 | Yes |
| 78 | Ifitm2 | 25708 | -0.494 | -0.2853 | Yes |
| 79 | Lgals3bp | 25733 | -0.497 | -0.2666 | Yes |
| 80 | Plscr1 | 26038 | -0.531 | -0.2567 | Yes |
| 81 | Casp1 | 26120 | -0.539 | -0.2385 | Yes |
| 82 | Psmb8 | 26287 | -0.560 | -0.2225 | Yes |
| 83 | Psme1 | 26572 | -0.603 | -0.2091 | Yes |
| 84 | Batf2 | 26731 | -0.626 | -0.1902 | Yes |
| 85 | Txnip | 26885 | -0.656 | -0.1699 | Yes |
| 86 | Epsti1 | 26990 | -0.678 | -0.1470 | Yes |
| 87 | Tent5a | 27031 | -0.688 | -0.1214 | Yes |
| 88 | Ifitm1 | 27075 | -0.700 | -0.0954 | Yes |
| 89 | Trim14 | 27079 | -0.700 | -0.0680 | Yes |
| 90 | Mvb12a | 27131 | -0.718 | -0.0416 | Yes |
| 91 | Tmem140 | 27174 | -0.732 | -0.0143 | Yes |
| 92 | Csf1 | 27254 | -0.759 | 0.0126 | Yes |