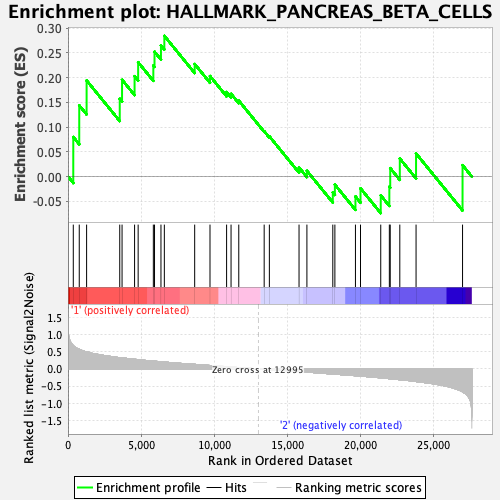
Profile of the Running ES Score & Positions of GeneSet Members on the Rank Ordered List
| Dataset | MEP.MEP.ery_Pheno.cls #Group2_versus_Group3.MEP.ery_Pheno.cls #Group2_versus_Group3_repos |
| Phenotype | MEP.ery_Pheno.cls#Group2_versus_Group3_repos |
| Upregulated in class | 1 |
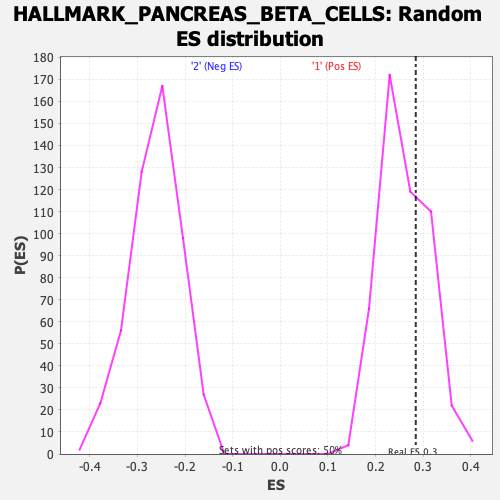
| GeneSet | HALLMARK_PANCREAS_BETA_CELLS |
| Enrichment Score (ES) | 0.28448996 |
| Normalized Enrichment Score (NES) | 1.0880836 |
| Nominal p-value | 0.32064128 |
| FDR q-value | 0.56101924 |
| FWER p-Value | 0.981 |
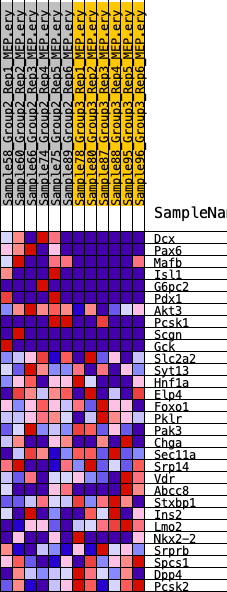
| SYMBOL | RANK IN GENE LIST | RANK METRIC SCORE | RUNNING ES | CORE ENRICHMENT | |
|---|---|---|---|---|---|
| 1 | Dcx | 361 | 0.675 | 0.0800 | Yes |
| 2 | Pax6 | 769 | 0.571 | 0.1438 | Yes |
| 3 | Mafb | 1272 | 0.498 | 0.1943 | Yes |
| 4 | Isl1 | 3537 | 0.326 | 0.1571 | Yes |
| 5 | G6pc2 | 3695 | 0.321 | 0.1957 | Yes |
| 6 | Pdx1 | 4551 | 0.277 | 0.2029 | Yes |
| 7 | Akt3 | 4795 | 0.269 | 0.2312 | Yes |
| 8 | Pcsk1 | 5833 | 0.226 | 0.2246 | Yes |
| 9 | Scgn | 5914 | 0.223 | 0.2524 | Yes |
| 10 | Gck | 6354 | 0.208 | 0.2652 | Yes |
| 11 | Slc2a2 | 6585 | 0.201 | 0.2845 | Yes |
| 12 | Syt13 | 8659 | 0.132 | 0.2275 | No |
| 13 | Hnf1a | 9706 | 0.099 | 0.2032 | No |
| 14 | Elp4 | 10841 | 0.064 | 0.1709 | No |
| 15 | Foxo1 | 11145 | 0.054 | 0.1673 | No |
| 16 | Pklr | 11673 | 0.038 | 0.1535 | No |
| 17 | Pak3 | 13409 | -0.008 | 0.0917 | No |
| 18 | Chga | 13764 | -0.018 | 0.0813 | No |
| 19 | Sec11a | 15792 | -0.077 | 0.0183 | No |
| 20 | Srp14 | 16330 | -0.093 | 0.0117 | No |
| 21 | Vdr | 18100 | -0.148 | -0.0321 | No |
| 22 | Abcc8 | 18242 | -0.151 | -0.0164 | No |
| 23 | Stxbp1 | 19648 | -0.197 | -0.0402 | No |
| 24 | Ins2 | 19994 | -0.210 | -0.0238 | No |
| 25 | Lmo2 | 21377 | -0.260 | -0.0381 | No |
| 26 | Nkx2-2 | 21965 | -0.283 | -0.0204 | No |
| 27 | Srprb | 22026 | -0.287 | 0.0169 | No |
| 28 | Spcs1 | 22680 | -0.313 | 0.0364 | No |
| 29 | Dpp4 | 23791 | -0.366 | 0.0466 | No |
| 30 | Pcsk2 | 26969 | -0.665 | 0.0230 | No |