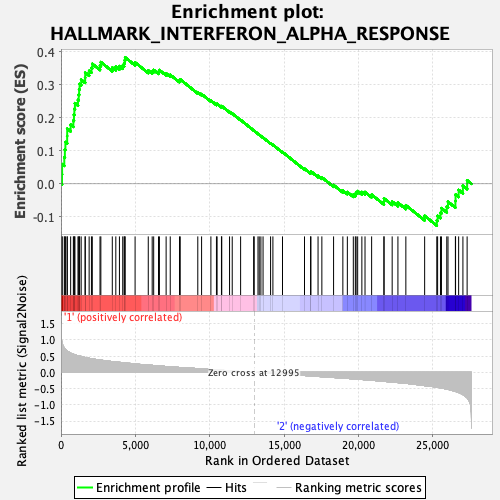
Profile of the Running ES Score & Positions of GeneSet Members on the Rank Ordered List
| Dataset | MEP.MEP.ery_Pheno.cls #Group2_versus_Group3.MEP.ery_Pheno.cls #Group2_versus_Group3_repos |
| Phenotype | MEP.ery_Pheno.cls#Group2_versus_Group3_repos |
| Upregulated in class | 1 |
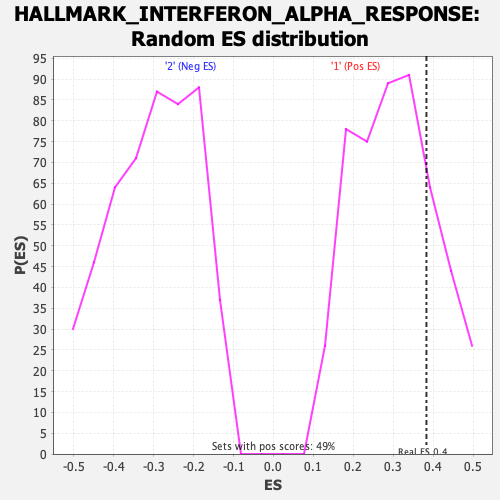
| GeneSet | HALLMARK_INTERFERON_ALPHA_RESPONSE |
| Enrichment Score (ES) | 0.38328338 |
| Normalized Enrichment Score (NES) | 1.2596627 |
| Nominal p-value | 0.22718053 |
| FDR q-value | 0.712482 |
| FWER p-Value | 0.908 |
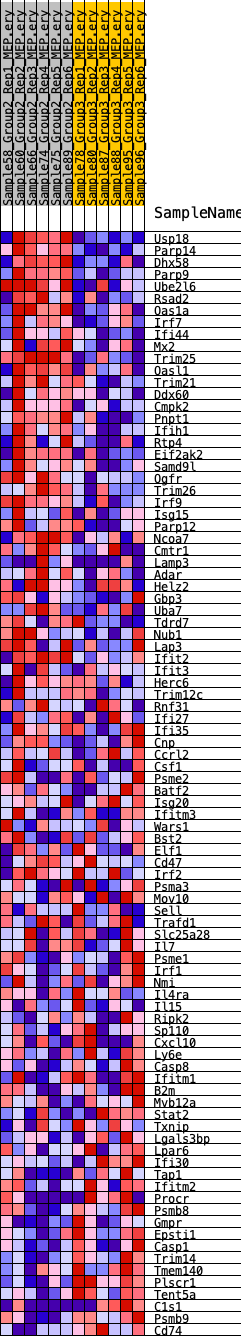
| SYMBOL | RANK IN GENE LIST | RANK METRIC SCORE | RUNNING ES | CORE ENRICHMENT | |
|---|---|---|---|---|---|
| 1 | Usp18 | 67 | 0.913 | 0.0290 | Yes |
| 2 | Parp14 | 74 | 0.902 | 0.0598 | Yes |
| 3 | Dhx58 | 221 | 0.748 | 0.0802 | Yes |
| 4 | Parp9 | 260 | 0.723 | 0.1037 | Yes |
| 5 | Ube2l6 | 296 | 0.705 | 0.1266 | Yes |
| 6 | Rsad2 | 414 | 0.656 | 0.1449 | Yes |
| 7 | Oas1a | 418 | 0.654 | 0.1673 | Yes |
| 8 | Irf7 | 649 | 0.590 | 0.1792 | Yes |
| 9 | Ifi44 | 831 | 0.560 | 0.1919 | Yes |
| 10 | Mx2 | 870 | 0.552 | 0.2095 | Yes |
| 11 | Trim25 | 898 | 0.547 | 0.2274 | Yes |
| 12 | Oasl1 | 937 | 0.540 | 0.2445 | Yes |
| 13 | Trim21 | 1142 | 0.510 | 0.2547 | Yes |
| 14 | Ddx60 | 1191 | 0.505 | 0.2703 | Yes |
| 15 | Cmpk2 | 1220 | 0.503 | 0.2866 | Yes |
| 16 | Pnpt1 | 1250 | 0.500 | 0.3027 | Yes |
| 17 | Ifih1 | 1356 | 0.492 | 0.3158 | Yes |
| 18 | Rtp4 | 1623 | 0.454 | 0.3217 | Yes |
| 19 | Eif2ak2 | 1629 | 0.454 | 0.3372 | Yes |
| 20 | Samd9l | 1892 | 0.434 | 0.3426 | Yes |
| 21 | Ogfr | 2047 | 0.422 | 0.3515 | Yes |
| 22 | Trim26 | 2104 | 0.418 | 0.3638 | Yes |
| 23 | Irf9 | 2623 | 0.381 | 0.3581 | Yes |
| 24 | Isg15 | 2680 | 0.377 | 0.3691 | Yes |
| 25 | Parp12 | 3449 | 0.331 | 0.3525 | Yes |
| 26 | Ncoa7 | 3686 | 0.322 | 0.3550 | Yes |
| 27 | Cmtr1 | 3929 | 0.310 | 0.3569 | Yes |
| 28 | Lamp3 | 4151 | 0.298 | 0.3591 | Yes |
| 29 | Adar | 4244 | 0.294 | 0.3658 | Yes |
| 30 | Helz2 | 4281 | 0.292 | 0.3745 | Yes |
| 31 | Gbp3 | 4315 | 0.289 | 0.3833 | Yes |
| 32 | Uba7 | 4982 | 0.261 | 0.3680 | No |
| 33 | Tdrd7 | 5868 | 0.224 | 0.3436 | No |
| 34 | Nub1 | 6132 | 0.216 | 0.3415 | No |
| 35 | Lap3 | 6232 | 0.212 | 0.3451 | No |
| 36 | Ifit2 | 6557 | 0.201 | 0.3403 | No |
| 37 | Ifit3 | 6618 | 0.199 | 0.3449 | No |
| 38 | Herc6 | 7069 | 0.180 | 0.3348 | No |
| 39 | Trim12c | 7346 | 0.169 | 0.3306 | No |
| 40 | Rnf31 | 7968 | 0.151 | 0.3132 | No |
| 41 | Ifi27 | 8017 | 0.150 | 0.3166 | No |
| 42 | Ifi35 | 9198 | 0.115 | 0.2777 | No |
| 43 | Cnp | 9454 | 0.107 | 0.2721 | No |
| 44 | Ccrl2 | 10079 | 0.088 | 0.2524 | No |
| 45 | Csf1 | 10453 | 0.077 | 0.2415 | No |
| 46 | Psme2 | 10496 | 0.075 | 0.2425 | No |
| 47 | Batf2 | 10790 | 0.065 | 0.2341 | No |
| 48 | Isg20 | 10810 | 0.064 | 0.2357 | No |
| 49 | Ifitm3 | 11334 | 0.048 | 0.2183 | No |
| 50 | Wars1 | 11514 | 0.043 | 0.2133 | No |
| 51 | Bst2 | 12078 | 0.026 | 0.1937 | No |
| 52 | Elf1 | 12953 | 0.001 | 0.1620 | No |
| 53 | Cd47 | 12992 | 0.000 | 0.1606 | No |
| 54 | Irf2 | 13247 | -0.003 | 0.1515 | No |
| 55 | Psma3 | 13329 | -0.005 | 0.1487 | No |
| 56 | Mov10 | 13441 | -0.009 | 0.1450 | No |
| 57 | Sell | 13587 | -0.013 | 0.1401 | No |
| 58 | Trafd1 | 14093 | -0.027 | 0.1227 | No |
| 59 | Slc25a28 | 14249 | -0.031 | 0.1181 | No |
| 60 | Il7 | 14894 | -0.050 | 0.0964 | No |
| 61 | Psme1 | 16374 | -0.094 | 0.0459 | No |
| 62 | Irf1 | 16782 | -0.106 | 0.0348 | No |
| 63 | Nmi | 16805 | -0.107 | 0.0376 | No |
| 64 | Il4ra | 17285 | -0.121 | 0.0244 | No |
| 65 | Il15 | 17541 | -0.130 | 0.0196 | No |
| 66 | Ripk2 | 18329 | -0.155 | -0.0037 | No |
| 67 | Sp110 | 18953 | -0.174 | -0.0203 | No |
| 68 | Cxcl10 | 19255 | -0.184 | -0.0250 | No |
| 69 | Ly6e | 19656 | -0.197 | -0.0327 | No |
| 70 | Casp8 | 19791 | -0.202 | -0.0306 | No |
| 71 | Ifitm1 | 19844 | -0.205 | -0.0255 | No |
| 72 | B2m | 19949 | -0.208 | -0.0221 | No |
| 73 | Mvb12a | 20231 | -0.216 | -0.0249 | No |
| 74 | Stat2 | 20443 | -0.224 | -0.0249 | No |
| 75 | Txnip | 20888 | -0.239 | -0.0328 | No |
| 76 | Lgals3bp | 21714 | -0.273 | -0.0534 | No |
| 77 | Lpar6 | 21723 | -0.273 | -0.0443 | No |
| 78 | Ifi30 | 22269 | -0.297 | -0.0539 | No |
| 79 | Tap1 | 22656 | -0.312 | -0.0572 | No |
| 80 | Ifitm2 | 23189 | -0.336 | -0.0650 | No |
| 81 | Procr | 24453 | -0.405 | -0.0970 | No |
| 82 | Psmb8 | 25270 | -0.455 | -0.1110 | No |
| 83 | Gmpr | 25325 | -0.459 | -0.0971 | No |
| 84 | Epsti1 | 25517 | -0.473 | -0.0878 | No |
| 85 | Casp1 | 25583 | -0.478 | -0.0737 | No |
| 86 | Trim14 | 25941 | -0.511 | -0.0691 | No |
| 87 | Tmem140 | 26023 | -0.520 | -0.0542 | No |
| 88 | Plscr1 | 26520 | -0.583 | -0.0522 | No |
| 89 | Tent5a | 26532 | -0.585 | -0.0325 | No |
| 90 | C1s1 | 26739 | -0.618 | -0.0187 | No |
| 91 | Psmb9 | 27026 | -0.677 | -0.0058 | No |
| 92 | Cd74 | 27309 | -0.776 | 0.0107 | No |