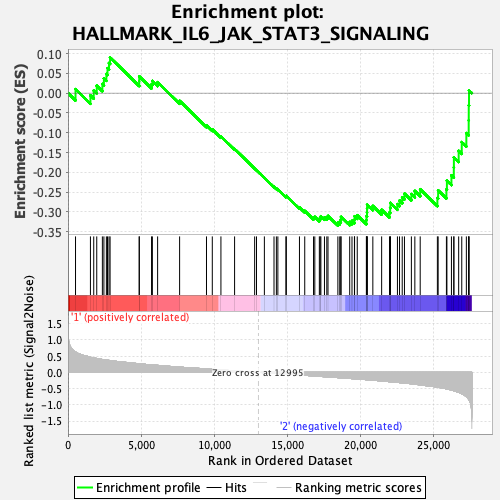
Profile of the Running ES Score & Positions of GeneSet Members on the Rank Ordered List
| Dataset | MEP.MEP.ery_Pheno.cls #Group2_versus_Group3.MEP.ery_Pheno.cls #Group2_versus_Group3_repos |
| Phenotype | MEP.ery_Pheno.cls#Group2_versus_Group3_repos |
| Upregulated in class | 2 |
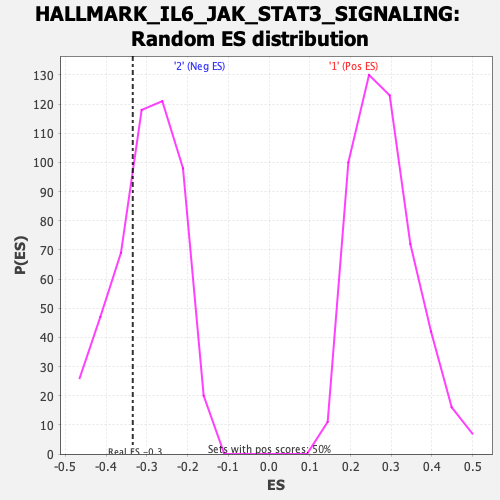
| GeneSet | HALLMARK_IL6_JAK_STAT3_SIGNALING |
| Enrichment Score (ES) | -0.33474272 |
| Normalized Enrichment Score (NES) | -1.1224866 |
| Nominal p-value | 0.2965932 |
| FDR q-value | 0.687152 |
| FWER p-Value | 0.978 |
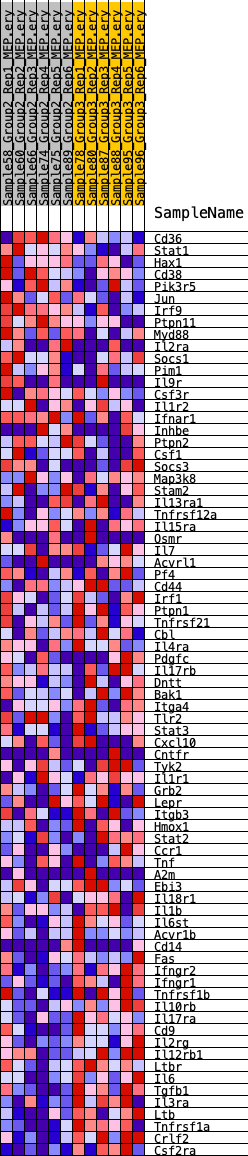
| SYMBOL | RANK IN GENE LIST | RANK METRIC SCORE | RUNNING ES | CORE ENRICHMENT | |
|---|---|---|---|---|---|
| 1 | Cd36 | 514 | 0.627 | 0.0100 | No |
| 2 | Stat1 | 1533 | 0.468 | -0.0055 | No |
| 3 | Hax1 | 1759 | 0.444 | 0.0066 | No |
| 4 | Cd38 | 1965 | 0.428 | 0.0188 | No |
| 5 | Pik3r5 | 2349 | 0.397 | 0.0231 | No |
| 6 | Jun | 2454 | 0.390 | 0.0372 | No |
| 7 | Irf9 | 2623 | 0.381 | 0.0485 | No |
| 8 | Ptpn11 | 2700 | 0.376 | 0.0630 | No |
| 9 | Myd88 | 2802 | 0.369 | 0.0762 | No |
| 10 | Il2ra | 2876 | 0.364 | 0.0903 | No |
| 11 | Socs1 | 4869 | 0.266 | 0.0301 | No |
| 12 | Pim1 | 4871 | 0.266 | 0.0422 | No |
| 13 | Il9r | 5711 | 0.231 | 0.0223 | No |
| 14 | Csf3r | 5767 | 0.228 | 0.0308 | No |
| 15 | Il1r2 | 6126 | 0.216 | 0.0276 | No |
| 16 | Ifnar1 | 7629 | 0.163 | -0.0195 | No |
| 17 | Inhbe | 9466 | 0.106 | -0.0813 | No |
| 18 | Ptpn2 | 9863 | 0.094 | -0.0914 | No |
| 19 | Csf1 | 10453 | 0.077 | -0.1093 | No |
| 20 | Socs3 | 11387 | 0.047 | -0.1410 | No |
| 21 | Map3k8 | 12758 | 0.008 | -0.1905 | No |
| 22 | Stam2 | 12884 | 0.004 | -0.1948 | No |
| 23 | Il13ra1 | 13423 | -0.008 | -0.2140 | No |
| 24 | Tnfrsf12a | 14081 | -0.026 | -0.2367 | No |
| 25 | Il15ra | 14243 | -0.031 | -0.2411 | No |
| 26 | Osmr | 14345 | -0.034 | -0.2432 | No |
| 27 | Il7 | 14894 | -0.050 | -0.2608 | No |
| 28 | Acvrl1 | 14924 | -0.051 | -0.2595 | No |
| 29 | Pf4 | 15821 | -0.077 | -0.2885 | No |
| 30 | Cd44 | 16182 | -0.088 | -0.2976 | No |
| 31 | Irf1 | 16782 | -0.106 | -0.3145 | No |
| 32 | Ptpn1 | 16870 | -0.109 | -0.3127 | No |
| 33 | Tnfrsf21 | 17180 | -0.119 | -0.3185 | No |
| 34 | Cbl | 17234 | -0.121 | -0.3149 | No |
| 35 | Il4ra | 17285 | -0.121 | -0.3111 | No |
| 36 | Pdgfc | 17530 | -0.130 | -0.3141 | No |
| 37 | Il17rb | 17691 | -0.135 | -0.3137 | No |
| 38 | Dntt | 17772 | -0.138 | -0.3103 | No |
| 39 | Bak1 | 18447 | -0.158 | -0.3275 | Yes |
| 40 | Itga4 | 18574 | -0.162 | -0.3246 | Yes |
| 41 | Tlr2 | 18647 | -0.165 | -0.3197 | Yes |
| 42 | Stat3 | 18664 | -0.166 | -0.3127 | Yes |
| 43 | Cxcl10 | 19255 | -0.184 | -0.3257 | Yes |
| 44 | Cntfr | 19412 | -0.189 | -0.3227 | Yes |
| 45 | Tyk2 | 19579 | -0.194 | -0.3198 | Yes |
| 46 | Il1r1 | 19588 | -0.194 | -0.3112 | Yes |
| 47 | Grb2 | 19771 | -0.201 | -0.3086 | Yes |
| 48 | Lepr | 20395 | -0.222 | -0.3210 | Yes |
| 49 | Itgb3 | 20403 | -0.223 | -0.3111 | Yes |
| 50 | Hmox1 | 20437 | -0.224 | -0.3020 | Yes |
| 51 | Stat2 | 20443 | -0.224 | -0.2919 | Yes |
| 52 | Ccr1 | 20448 | -0.225 | -0.2818 | Yes |
| 53 | Tnf | 20837 | -0.237 | -0.2850 | Yes |
| 54 | A2m | 21439 | -0.263 | -0.2948 | Yes |
| 55 | Ebi3 | 21977 | -0.284 | -0.3013 | Yes |
| 56 | Il18r1 | 22023 | -0.287 | -0.2898 | Yes |
| 57 | Il1b | 22042 | -0.287 | -0.2773 | Yes |
| 58 | Il6st | 22518 | -0.306 | -0.2806 | Yes |
| 59 | Acvr1b | 22661 | -0.312 | -0.2714 | Yes |
| 60 | Cd14 | 22845 | -0.320 | -0.2634 | Yes |
| 61 | Fas | 22998 | -0.327 | -0.2540 | Yes |
| 62 | Ifngr2 | 23471 | -0.349 | -0.2551 | Yes |
| 63 | Ifngr1 | 23708 | -0.362 | -0.2471 | Yes |
| 64 | Tnfrsf1b | 24074 | -0.381 | -0.2429 | Yes |
| 65 | Il10rb | 25248 | -0.453 | -0.2648 | Yes |
| 66 | Il17ra | 25301 | -0.457 | -0.2458 | Yes |
| 67 | Cd9 | 25866 | -0.504 | -0.2432 | Yes |
| 68 | Il2rg | 25900 | -0.507 | -0.2212 | Yes |
| 69 | Il12rb1 | 26209 | -0.540 | -0.2076 | Yes |
| 70 | Ltbr | 26372 | -0.562 | -0.1878 | Yes |
| 71 | Il6 | 26377 | -0.563 | -0.1621 | Yes |
| 72 | Tgfb1 | 26704 | -0.611 | -0.1460 | Yes |
| 73 | Il3ra | 26915 | -0.652 | -0.1238 | Yes |
| 74 | Ltb | 27229 | -0.744 | -0.1010 | Yes |
| 75 | Tnfrsf1a | 27389 | -0.828 | -0.0689 | Yes |
| 76 | Crlf2 | 27393 | -0.829 | -0.0310 | Yes |
| 77 | Csf2ra | 27412 | -0.843 | 0.0069 | Yes |