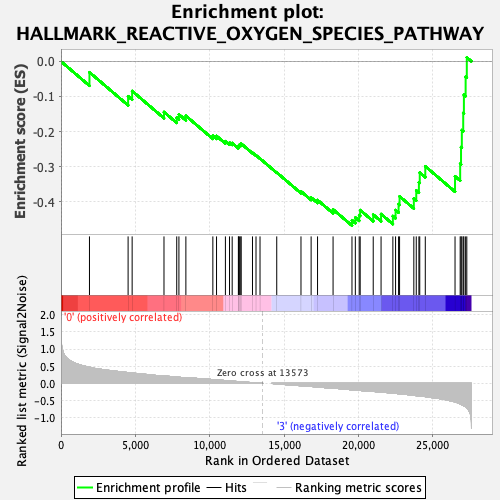
Profile of the Running ES Score & Positions of GeneSet Members on the Rank Ordered List
| Dataset | MEP.MEP.ery_Pheno.cls #Group1_versus_Group4.MEP.ery_Pheno.cls #Group1_versus_Group4_repos |
| Phenotype | MEP.ery_Pheno.cls#Group1_versus_Group4_repos |
| Upregulated in class | 3 |
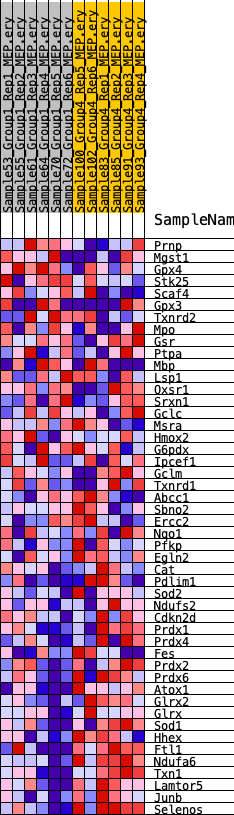
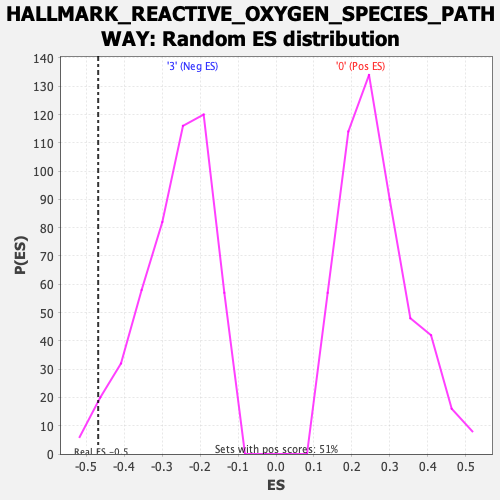
| GeneSet | HALLMARK_REACTIVE_OXYGEN_SPECIES_PATHWAY |
| Enrichment Score (ES) | -0.468354 |
| Normalized Enrichment Score (NES) | -1.7773554 |
| Nominal p-value | 0.024439918 |
| FDR q-value | 0.15139996 |
| FWER p-Value | 0.07 |
| SYMBOL | RANK IN GENE LIST | RANK METRIC SCORE | RUNNING ES | CORE ENRICHMENT | |
|---|---|---|---|---|---|
| 1 | Prnp | 1914 | 0.470 | -0.0310 | No |
| 2 | Mgst1 | 4512 | 0.315 | -0.0995 | No |
| 3 | Gpx4 | 4784 | 0.303 | -0.0845 | No |
| 4 | Stk25 | 6925 | 0.217 | -0.1443 | No |
| 5 | Scaf4 | 7782 | 0.183 | -0.1604 | No |
| 6 | Gpx3 | 7929 | 0.176 | -0.1513 | No |
| 7 | Txnrd2 | 8397 | 0.158 | -0.1553 | No |
| 8 | Mpo | 10211 | 0.110 | -0.2120 | No |
| 9 | Gsr | 10459 | 0.101 | -0.2127 | No |
| 10 | Ptpa | 11055 | 0.082 | -0.2276 | No |
| 11 | Mbp | 11332 | 0.071 | -0.2318 | No |
| 12 | Lsp1 | 11511 | 0.066 | -0.2328 | No |
| 13 | Oxsr1 | 11927 | 0.052 | -0.2436 | No |
| 14 | Srxn1 | 11948 | 0.051 | -0.2402 | No |
| 15 | Gclc | 11994 | 0.050 | -0.2377 | No |
| 16 | Msra | 12095 | 0.046 | -0.2376 | No |
| 17 | Hmox2 | 12107 | 0.046 | -0.2343 | No |
| 18 | G6pdx | 12876 | 0.020 | -0.2605 | No |
| 19 | Ipcef1 | 13113 | 0.015 | -0.2679 | No |
| 20 | Gclm | 13383 | 0.006 | -0.2771 | No |
| 21 | Txnrd1 | 14507 | -0.012 | -0.3169 | No |
| 22 | Abcc1 | 16137 | -0.066 | -0.3707 | No |
| 23 | Sbno2 | 16819 | -0.087 | -0.3883 | No |
| 24 | Ercc2 | 17251 | -0.103 | -0.3955 | No |
| 25 | Nqo1 | 18295 | -0.135 | -0.4223 | No |
| 26 | Pfkp | 19566 | -0.186 | -0.4531 | Yes |
| 27 | Egln2 | 19792 | -0.194 | -0.4454 | Yes |
| 28 | Cat | 20051 | -0.200 | -0.4384 | Yes |
| 29 | Pdlim1 | 20118 | -0.203 | -0.4242 | Yes |
| 30 | Sod2 | 20995 | -0.231 | -0.4370 | Yes |
| 31 | Ndufs2 | 21522 | -0.253 | -0.4354 | Yes |
| 32 | Cdkn2d | 22316 | -0.282 | -0.4411 | Yes |
| 33 | Prdx1 | 22498 | -0.288 | -0.4241 | Yes |
| 34 | Prdx4 | 22700 | -0.297 | -0.4071 | Yes |
| 35 | Fes | 22767 | -0.300 | -0.3849 | Yes |
| 36 | Prdx2 | 23725 | -0.345 | -0.3914 | Yes |
| 37 | Prdx6 | 23889 | -0.354 | -0.3683 | Yes |
| 38 | Atox1 | 24067 | -0.363 | -0.3449 | Yes |
| 39 | Glrx2 | 24124 | -0.365 | -0.3171 | Yes |
| 40 | Glrx | 24496 | -0.382 | -0.2992 | Yes |
| 41 | Sod1 | 26496 | -0.538 | -0.3277 | Yes |
| 42 | Hhex | 26842 | -0.592 | -0.2917 | Yes |
| 43 | Ftl1 | 26900 | -0.603 | -0.2444 | Yes |
| 44 | Ndufa6 | 26954 | -0.615 | -0.1959 | Yes |
| 45 | Txn1 | 27047 | -0.640 | -0.1468 | Yes |
| 46 | Lamtor5 | 27093 | -0.650 | -0.0953 | Yes |
| 47 | Junb | 27209 | -0.680 | -0.0438 | Yes |
| 48 | Selenos | 27288 | -0.708 | 0.0114 | Yes |