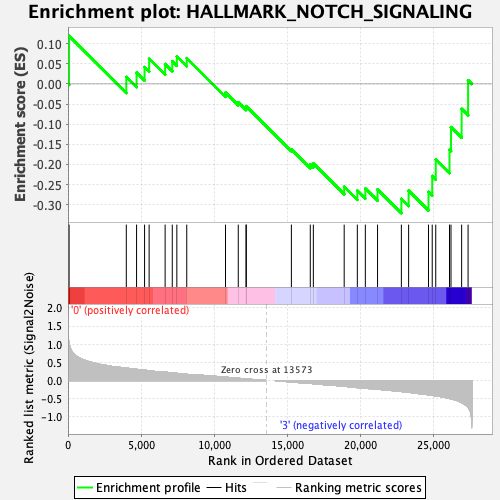
Profile of the Running ES Score & Positions of GeneSet Members on the Rank Ordered List
| Dataset | MEP.MEP.ery_Pheno.cls #Group1_versus_Group4.MEP.ery_Pheno.cls #Group1_versus_Group4_repos |
| Phenotype | MEP.ery_Pheno.cls#Group1_versus_Group4_repos |
| Upregulated in class | 3 |
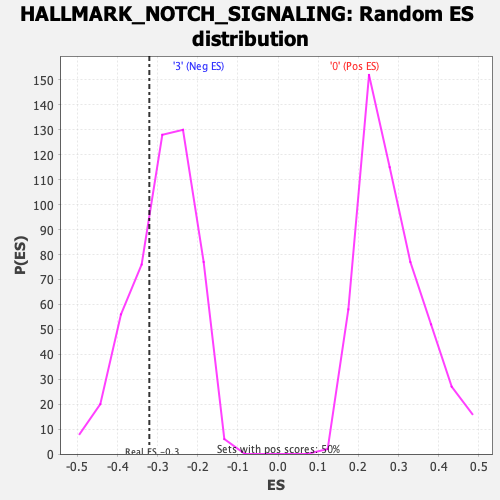
| GeneSet | HALLMARK_NOTCH_SIGNALING |
| Enrichment Score (ES) | -0.32084683 |
| Normalized Enrichment Score (NES) | -1.1188378 |
| Nominal p-value | 0.30339321 |
| FDR q-value | 0.57590467 |
| FWER p-Value | 0.987 |
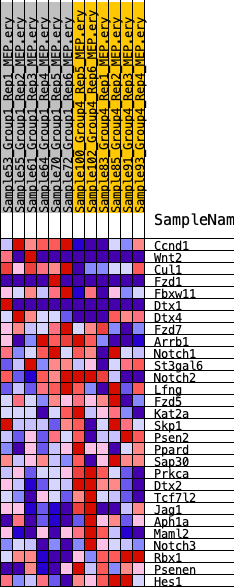
| SYMBOL | RANK IN GENE LIST | RANK METRIC SCORE | RUNNING ES | CORE ENRICHMENT | |
|---|---|---|---|---|---|
| 1 | Ccnd1 | 73 | 1.031 | 0.1194 | No |
| 2 | Wnt2 | 3985 | 0.336 | 0.0173 | No |
| 3 | Cul1 | 4687 | 0.308 | 0.0283 | No |
| 4 | Fzd1 | 5234 | 0.281 | 0.0418 | No |
| 5 | Fbxw11 | 5545 | 0.269 | 0.0624 | No |
| 6 | Dtx1 | 6639 | 0.225 | 0.0494 | No |
| 7 | Dtx4 | 7127 | 0.208 | 0.0564 | No |
| 8 | Fzd7 | 7440 | 0.196 | 0.0683 | No |
| 9 | Arrb1 | 8117 | 0.170 | 0.0640 | No |
| 10 | Notch1 | 10766 | 0.091 | -0.0213 | No |
| 11 | St3gal6 | 11638 | 0.061 | -0.0456 | No |
| 12 | Notch2 | 12169 | 0.044 | -0.0597 | No |
| 13 | Lfng | 12187 | 0.043 | -0.0552 | No |
| 14 | Fzd5 | 15269 | -0.039 | -0.1623 | No |
| 15 | Kat2a | 16561 | -0.078 | -0.1999 | No |
| 16 | Skp1 | 16770 | -0.085 | -0.1974 | No |
| 17 | Psen2 | 18878 | -0.157 | -0.2552 | No |
| 18 | Ppard | 19777 | -0.193 | -0.2649 | No |
| 19 | Sap30 | 20324 | -0.211 | -0.2598 | No |
| 20 | Prkca | 21159 | -0.238 | -0.2618 | No |
| 21 | Dtx2 | 22787 | -0.301 | -0.2852 | Yes |
| 22 | Tcf7l2 | 23283 | -0.322 | -0.2650 | Yes |
| 23 | Jag1 | 24641 | -0.392 | -0.2678 | Yes |
| 24 | Aph1a | 24896 | -0.409 | -0.2286 | Yes |
| 25 | Maml2 | 25137 | -0.421 | -0.1875 | Yes |
| 26 | Notch3 | 26077 | -0.493 | -0.1632 | Yes |
| 27 | Rbx1 | 26179 | -0.504 | -0.1072 | Yes |
| 28 | Psenen | 26907 | -0.606 | -0.0618 | Yes |
| 29 | Hes1 | 27347 | -0.735 | 0.0092 | Yes |