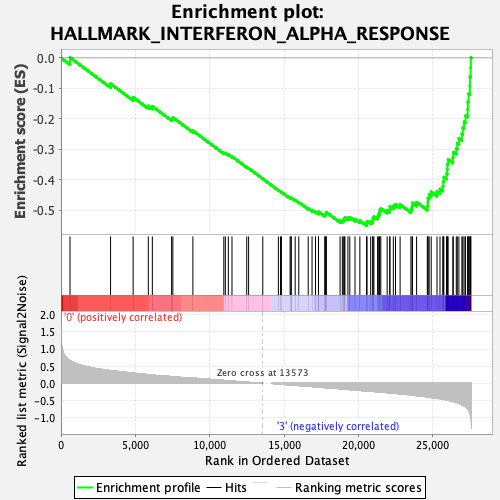
Profile of the Running ES Score & Positions of GeneSet Members on the Rank Ordered List
| Dataset | MEP.MEP.ery_Pheno.cls #Group1_versus_Group4.MEP.ery_Pheno.cls #Group1_versus_Group4_repos |
| Phenotype | MEP.ery_Pheno.cls#Group1_versus_Group4_repos |
| Upregulated in class | 3 |
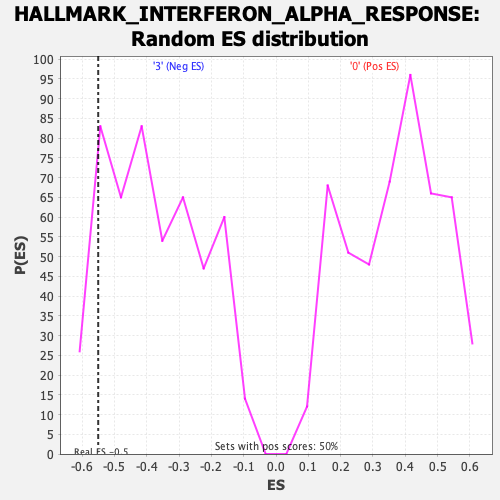
| GeneSet | HALLMARK_INTERFERON_ALPHA_RESPONSE |
| Enrichment Score (ES) | -0.54995495 |
| Normalized Enrichment Score (NES) | -1.4691614 |
| Nominal p-value | 0.1167002 |
| FDR q-value | 0.33991942 |
| FWER p-Value | 0.564 |
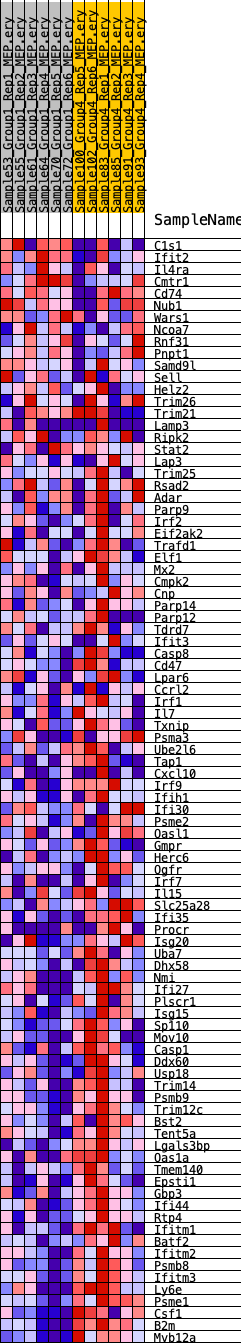
| SYMBOL | RANK IN GENE LIST | RANK METRIC SCORE | RUNNING ES | CORE ENRICHMENT | |
|---|---|---|---|---|---|
| 1 | C1s1 | 606 | 0.664 | 0.0012 | No |
| 2 | Ifit2 | 3332 | 0.373 | -0.0847 | No |
| 3 | Il4ra | 4850 | 0.300 | -0.1294 | No |
| 4 | Cmtr1 | 5872 | 0.252 | -0.1576 | No |
| 5 | Cd74 | 6142 | 0.241 | -0.1590 | No |
| 6 | Nub1 | 7436 | 0.197 | -0.1991 | No |
| 7 | Wars1 | 7523 | 0.193 | -0.1955 | No |
| 8 | Ncoa7 | 8869 | 0.154 | -0.2390 | No |
| 9 | Rnf31 | 10949 | 0.085 | -0.3115 | No |
| 10 | Pnpt1 | 11050 | 0.082 | -0.3123 | No |
| 11 | Samd9l | 11251 | 0.074 | -0.3170 | No |
| 12 | Sell | 11498 | 0.066 | -0.3236 | No |
| 13 | Helz2 | 12488 | 0.033 | -0.3584 | No |
| 14 | Trim26 | 12616 | 0.029 | -0.3620 | No |
| 15 | Trim21 | 13568 | 0.000 | -0.3965 | No |
| 16 | Lamp3 | 14618 | -0.015 | -0.4341 | No |
| 17 | Ripk2 | 14762 | -0.020 | -0.4386 | No |
| 18 | Stat2 | 14822 | -0.023 | -0.4400 | No |
| 19 | Lap3 | 15406 | -0.044 | -0.4596 | No |
| 20 | Trim25 | 15471 | -0.046 | -0.4603 | No |
| 21 | Rsad2 | 15477 | -0.046 | -0.4589 | No |
| 22 | Adar | 15747 | -0.054 | -0.4668 | No |
| 23 | Parp9 | 15990 | -0.062 | -0.4734 | No |
| 24 | Irf2 | 16623 | -0.080 | -0.4936 | No |
| 25 | Eif2ak2 | 16881 | -0.089 | -0.4998 | No |
| 26 | Trafd1 | 17114 | -0.098 | -0.5048 | No |
| 27 | Elf1 | 17314 | -0.105 | -0.5084 | No |
| 28 | Mx2 | 17315 | -0.105 | -0.5047 | No |
| 29 | Cmpk2 | 17734 | -0.121 | -0.5156 | No |
| 30 | Cnp | 17777 | -0.122 | -0.5128 | No |
| 31 | Parp14 | 17816 | -0.124 | -0.5099 | No |
| 32 | Parp12 | 17841 | -0.125 | -0.5064 | No |
| 33 | Tdrd7 | 18766 | -0.153 | -0.5346 | No |
| 34 | Ifit3 | 18919 | -0.158 | -0.5345 | No |
| 35 | Casp8 | 18983 | -0.161 | -0.5312 | No |
| 36 | Cd47 | 19077 | -0.164 | -0.5288 | No |
| 37 | Lpar6 | 19082 | -0.165 | -0.5232 | No |
| 38 | Ccrl2 | 19294 | -0.174 | -0.5247 | No |
| 39 | Irf1 | 19420 | -0.180 | -0.5230 | No |
| 40 | Il7 | 19770 | -0.193 | -0.5289 | No |
| 41 | Txnip | 20096 | -0.202 | -0.5336 | No |
| 42 | Psma3 | 20547 | -0.220 | -0.5423 | Yes |
| 43 | Ube2l6 | 20579 | -0.221 | -0.5356 | Yes |
| 44 | Tap1 | 20823 | -0.223 | -0.5366 | Yes |
| 45 | Cxcl10 | 20960 | -0.230 | -0.5335 | Yes |
| 46 | Irf9 | 20977 | -0.231 | -0.5260 | Yes |
| 47 | Ifih1 | 21039 | -0.233 | -0.5201 | Yes |
| 48 | Ifi30 | 21289 | -0.243 | -0.5206 | Yes |
| 49 | Psme2 | 21339 | -0.245 | -0.5138 | Yes |
| 50 | Oasl1 | 21422 | -0.248 | -0.5080 | Yes |
| 51 | Gmpr | 21429 | -0.249 | -0.4995 | Yes |
| 52 | Herc6 | 21504 | -0.252 | -0.4934 | Yes |
| 53 | Ogfr | 21933 | -0.266 | -0.4996 | Yes |
| 54 | Irf7 | 22108 | -0.274 | -0.4963 | Yes |
| 55 | Il15 | 22116 | -0.274 | -0.4870 | Yes |
| 56 | Slc25a28 | 22348 | -0.283 | -0.4854 | Yes |
| 57 | Ifi35 | 22492 | -0.288 | -0.4805 | Yes |
| 58 | Procr | 22802 | -0.302 | -0.4812 | Yes |
| 59 | Isg20 | 23530 | -0.335 | -0.4959 | Yes |
| 60 | Uba7 | 23609 | -0.339 | -0.4868 | Yes |
| 61 | Dhx58 | 23636 | -0.340 | -0.4758 | Yes |
| 62 | Nmi | 23912 | -0.355 | -0.4733 | Yes |
| 63 | Ifi27 | 24632 | -0.392 | -0.4857 | Yes |
| 64 | Plscr1 | 24667 | -0.394 | -0.4732 | Yes |
| 65 | Isg15 | 24677 | -0.395 | -0.4596 | Yes |
| 66 | Sp110 | 24756 | -0.399 | -0.4485 | Yes |
| 67 | Mov10 | 24894 | -0.409 | -0.4391 | Yes |
| 68 | Casp1 | 25284 | -0.429 | -0.4382 | Yes |
| 69 | Ddx60 | 25485 | -0.443 | -0.4299 | Yes |
| 70 | Usp18 | 25673 | -0.456 | -0.4207 | Yes |
| 71 | Trim14 | 25707 | -0.460 | -0.4058 | Yes |
| 72 | Psmb9 | 25742 | -0.462 | -0.3908 | Yes |
| 73 | Trim12c | 25920 | -0.480 | -0.3805 | Yes |
| 74 | Bst2 | 25968 | -0.484 | -0.3652 | Yes |
| 75 | Tent5a | 25980 | -0.485 | -0.3486 | Yes |
| 76 | Lgals3bp | 26032 | -0.490 | -0.3332 | Yes |
| 77 | Oas1a | 26352 | -0.520 | -0.3266 | Yes |
| 78 | Tmem140 | 26376 | -0.523 | -0.3091 | Yes |
| 79 | Epsti1 | 26580 | -0.549 | -0.2972 | Yes |
| 80 | Gbp3 | 26646 | -0.559 | -0.2800 | Yes |
| 81 | Ifi44 | 26755 | -0.575 | -0.2637 | Yes |
| 82 | Rtp4 | 26956 | -0.617 | -0.2494 | Yes |
| 83 | Ifitm1 | 27018 | -0.633 | -0.2294 | Yes |
| 84 | Batf2 | 27106 | -0.654 | -0.2096 | Yes |
| 85 | Ifitm2 | 27201 | -0.676 | -0.1893 | Yes |
| 86 | Psmb8 | 27345 | -0.734 | -0.1688 | Yes |
| 87 | Ifitm3 | 27355 | -0.740 | -0.1431 | Yes |
| 88 | Ly6e | 27410 | -0.772 | -0.1180 | Yes |
| 89 | Psme1 | 27492 | -0.841 | -0.0914 | Yes |
| 90 | Csf1 | 27498 | -0.847 | -0.0619 | Yes |
| 91 | B2m | 27547 | -0.915 | -0.0316 | Yes |
| 92 | Mvb12a | 27557 | -0.957 | 0.0016 | Yes |