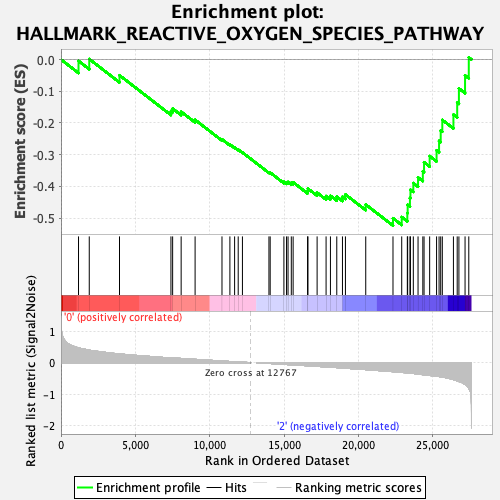
Profile of the Running ES Score & Positions of GeneSet Members on the Rank Ordered List
| Dataset | MEP.MEP.ery_Pheno.cls #Group1_versus_Group3.MEP.ery_Pheno.cls #Group1_versus_Group3_repos |
| Phenotype | MEP.ery_Pheno.cls#Group1_versus_Group3_repos |
| Upregulated in class | 2 |
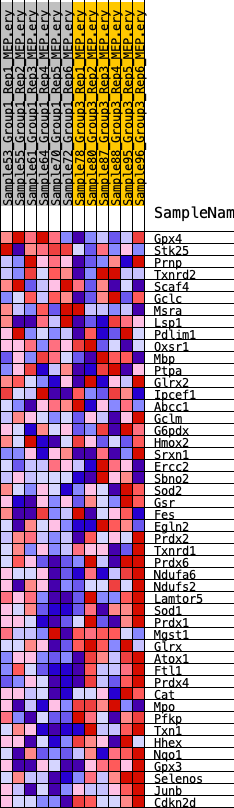
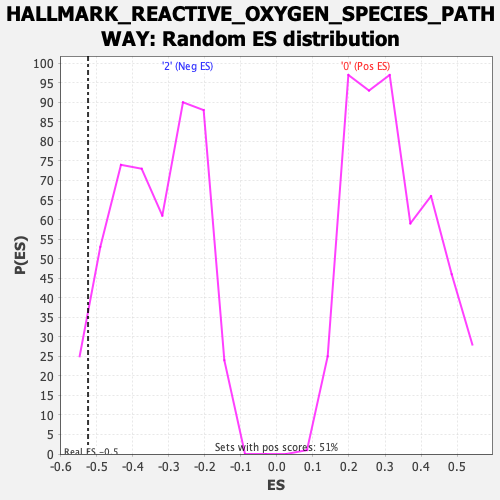
| GeneSet | HALLMARK_REACTIVE_OXYGEN_SPECIES_PATHWAY |
| Enrichment Score (ES) | -0.52377796 |
| Normalized Enrichment Score (NES) | -1.5678941 |
| Nominal p-value | 0.043032788 |
| FDR q-value | 1.0 |
| FWER p-Value | 0.407 |
| SYMBOL | RANK IN GENE LIST | RANK METRIC SCORE | RUNNING ES | CORE ENRICHMENT | |
|---|---|---|---|---|---|
| 1 | Gpx4 | 1178 | 0.469 | -0.0045 | No |
| 2 | Stk25 | 1900 | 0.395 | 0.0015 | No |
| 3 | Prnp | 3934 | 0.277 | -0.0497 | No |
| 4 | Txnrd2 | 7393 | 0.153 | -0.1628 | No |
| 5 | Scaf4 | 7507 | 0.149 | -0.1547 | No |
| 6 | Gclc | 8079 | 0.132 | -0.1647 | No |
| 7 | Msra | 9017 | 0.104 | -0.1902 | No |
| 8 | Lsp1 | 10825 | 0.051 | -0.2516 | No |
| 9 | Pdlim1 | 11357 | 0.036 | -0.2680 | No |
| 10 | Oxsr1 | 11674 | 0.028 | -0.2772 | No |
| 11 | Mbp | 11916 | 0.023 | -0.2841 | No |
| 12 | Ptpa | 12200 | 0.015 | -0.2931 | No |
| 13 | Glrx2 | 13983 | -0.024 | -0.3558 | No |
| 14 | Ipcef1 | 14066 | -0.026 | -0.3567 | No |
| 15 | Abcc1 | 14989 | -0.052 | -0.3859 | No |
| 16 | Gclm | 15166 | -0.058 | -0.3876 | No |
| 17 | G6pdx | 15267 | -0.061 | -0.3862 | No |
| 18 | Hmox2 | 15486 | -0.068 | -0.3886 | No |
| 19 | Srxn1 | 15609 | -0.071 | -0.3872 | No |
| 20 | Ercc2 | 16579 | -0.098 | -0.4144 | No |
| 21 | Sbno2 | 16606 | -0.099 | -0.4072 | No |
| 22 | Sod2 | 17222 | -0.119 | -0.4199 | No |
| 23 | Gsr | 17825 | -0.135 | -0.4307 | No |
| 24 | Fes | 18118 | -0.142 | -0.4297 | No |
| 25 | Egln2 | 18544 | -0.155 | -0.4325 | No |
| 26 | Prdx2 | 18926 | -0.168 | -0.4327 | No |
| 27 | Txnrd1 | 19126 | -0.174 | -0.4257 | No |
| 28 | Prdx6 | 20492 | -0.219 | -0.4573 | No |
| 29 | Ndufa6 | 22324 | -0.284 | -0.5006 | Yes |
| 30 | Ndufs2 | 22911 | -0.307 | -0.4969 | Yes |
| 31 | Lamtor5 | 23288 | -0.325 | -0.4840 | Yes |
| 32 | Sod1 | 23311 | -0.326 | -0.4583 | Yes |
| 33 | Prdx1 | 23464 | -0.333 | -0.4367 | Yes |
| 34 | Mgst1 | 23498 | -0.334 | -0.4106 | Yes |
| 35 | Glrx | 23691 | -0.342 | -0.3898 | Yes |
| 36 | Atox1 | 24009 | -0.360 | -0.3719 | Yes |
| 37 | Ftl1 | 24331 | -0.380 | -0.3525 | Yes |
| 38 | Prdx4 | 24413 | -0.385 | -0.3241 | Yes |
| 39 | Cat | 24790 | -0.406 | -0.3046 | Yes |
| 40 | Mpo | 25255 | -0.430 | -0.2864 | Yes |
| 41 | Pfkp | 25423 | -0.440 | -0.2566 | Yes |
| 42 | Txn1 | 25533 | -0.449 | -0.2239 | Yes |
| 43 | Hhex | 25641 | -0.458 | -0.1905 | Yes |
| 44 | Nqo1 | 26388 | -0.536 | -0.1738 | Yes |
| 45 | Gpx3 | 26642 | -0.577 | -0.1360 | Yes |
| 46 | Selenos | 26757 | -0.599 | -0.0913 | Yes |
| 47 | Junb | 27170 | -0.688 | -0.0502 | Yes |
| 48 | Cdkn2d | 27421 | -0.808 | 0.0066 | Yes |