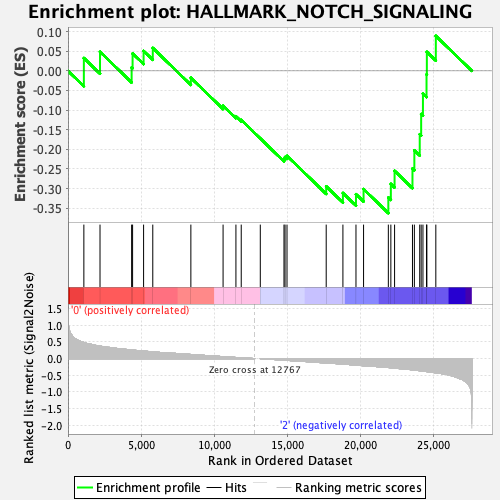
Profile of the Running ES Score & Positions of GeneSet Members on the Rank Ordered List
| Dataset | MEP.MEP.ery_Pheno.cls #Group1_versus_Group3.MEP.ery_Pheno.cls #Group1_versus_Group3_repos |
| Phenotype | MEP.ery_Pheno.cls#Group1_versus_Group3_repos |
| Upregulated in class | 2 |
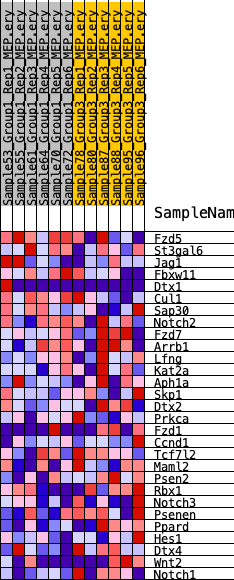
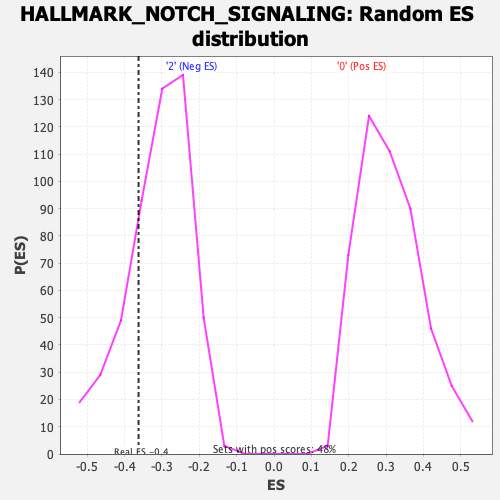
| GeneSet | HALLMARK_NOTCH_SIGNALING |
| Enrichment Score (ES) | -0.36274913 |
| Normalized Enrichment Score (NES) | -1.1665471 |
| Nominal p-value | 0.2616279 |
| FDR q-value | 0.52189445 |
| FWER p-Value | 0.949 |
| SYMBOL | RANK IN GENE LIST | RANK METRIC SCORE | RUNNING ES | CORE ENRICHMENT | |
|---|---|---|---|---|---|
| 1 | Fzd5 | 1084 | 0.481 | 0.0327 | No |
| 2 | St3gal6 | 2188 | 0.374 | 0.0486 | No |
| 3 | Jag1 | 4349 | 0.257 | 0.0087 | No |
| 4 | Fbxw11 | 4415 | 0.254 | 0.0444 | No |
| 5 | Dtx1 | 5167 | 0.225 | 0.0508 | No |
| 6 | Cul1 | 5795 | 0.203 | 0.0584 | No |
| 7 | Sap30 | 8398 | 0.123 | -0.0176 | No |
| 8 | Notch2 | 10600 | 0.058 | -0.0888 | No |
| 9 | Fzd7 | 11478 | 0.033 | -0.1157 | No |
| 10 | Arrb1 | 11841 | 0.024 | -0.1252 | No |
| 11 | Lfng | 13144 | -0.000 | -0.1724 | No |
| 12 | Kat2a | 14763 | -0.046 | -0.2242 | No |
| 13 | Aph1a | 14835 | -0.048 | -0.2196 | No |
| 14 | Skp1 | 14970 | -0.052 | -0.2167 | No |
| 15 | Dtx2 | 17649 | -0.130 | -0.2944 | No |
| 16 | Prkca | 18791 | -0.164 | -0.3113 | No |
| 17 | Fzd1 | 19684 | -0.195 | -0.3145 | No |
| 18 | Ccnd1 | 20203 | -0.213 | -0.3014 | No |
| 19 | Tcf7l2 | 21896 | -0.266 | -0.3229 | Yes |
| 20 | Maml2 | 22068 | -0.274 | -0.2882 | Yes |
| 21 | Psen2 | 22323 | -0.284 | -0.2549 | Yes |
| 22 | Rbx1 | 23546 | -0.336 | -0.2489 | Yes |
| 23 | Notch3 | 23675 | -0.341 | -0.2025 | Yes |
| 24 | Psenen | 24042 | -0.362 | -0.1617 | Yes |
| 25 | Ppard | 24140 | -0.369 | -0.1100 | Yes |
| 26 | Hes1 | 24262 | -0.375 | -0.0582 | Yes |
| 27 | Dtx4 | 24507 | -0.388 | -0.0091 | Yes |
| 28 | Wnt2 | 24529 | -0.389 | 0.0484 | Yes |
| 29 | Notch1 | 25142 | -0.421 | 0.0892 | Yes |