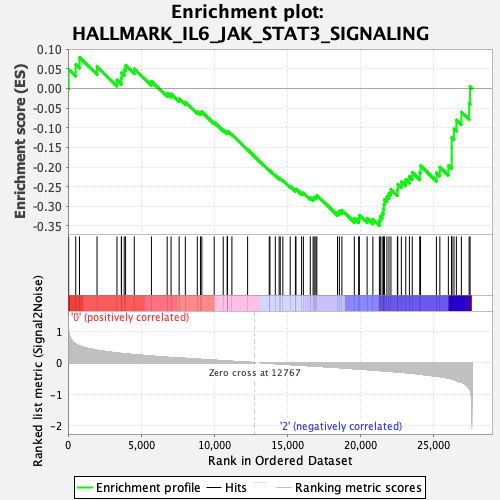
Profile of the Running ES Score & Positions of GeneSet Members on the Rank Ordered List
| Dataset | MEP.MEP.ery_Pheno.cls #Group1_versus_Group3.MEP.ery_Pheno.cls #Group1_versus_Group3_repos |
| Phenotype | MEP.ery_Pheno.cls#Group1_versus_Group3_repos |
| Upregulated in class | 2 |
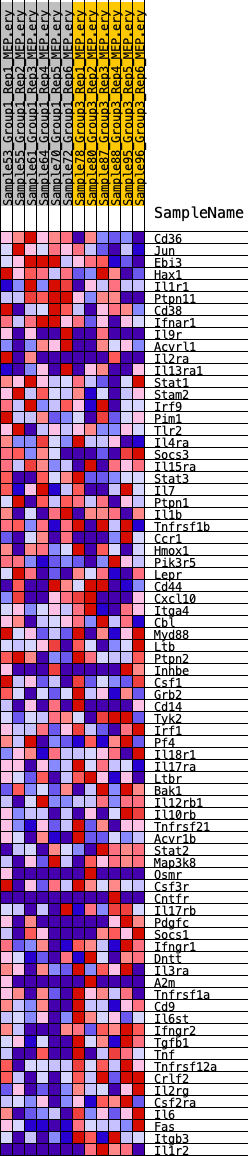
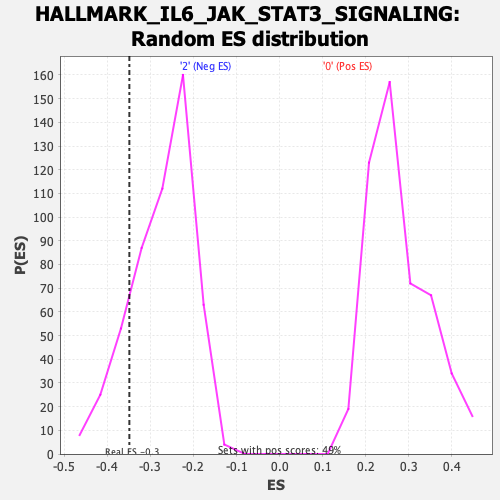
| GeneSet | HALLMARK_IL6_JAK_STAT3_SIGNALING |
| Enrichment Score (ES) | -0.3490444 |
| Normalized Enrichment Score (NES) | -1.2750782 |
| Nominal p-value | 0.14453125 |
| FDR q-value | 0.6562211 |
| FWER p-Value | 0.879 |
| SYMBOL | RANK IN GENE LIST | RANK METRIC SCORE | RUNNING ES | CORE ENRICHMENT | |
|---|---|---|---|---|---|
| 1 | Cd36 | 46 | 0.974 | 0.0485 | No |
| 2 | Jun | 529 | 0.586 | 0.0611 | No |
| 3 | Ebi3 | 784 | 0.528 | 0.0791 | No |
| 4 | Hax1 | 1985 | 0.387 | 0.0554 | No |
| 5 | Il1r1 | 3347 | 0.304 | 0.0216 | No |
| 6 | Ptpn11 | 3646 | 0.288 | 0.0256 | No |
| 7 | Cd38 | 3657 | 0.287 | 0.0401 | No |
| 8 | Ifnar1 | 3839 | 0.281 | 0.0480 | No |
| 9 | Il9r | 3936 | 0.277 | 0.0587 | No |
| 10 | Acvrl1 | 4529 | 0.250 | 0.0501 | No |
| 11 | Il2ra | 5703 | 0.206 | 0.0181 | No |
| 12 | Il13ra1 | 6778 | 0.167 | -0.0123 | No |
| 13 | Stat1 | 7046 | 0.158 | -0.0139 | No |
| 14 | Stam2 | 7596 | 0.146 | -0.0263 | No |
| 15 | Irf9 | 8020 | 0.134 | -0.0348 | No |
| 16 | Pim1 | 8838 | 0.109 | -0.0589 | No |
| 17 | Tlr2 | 9054 | 0.102 | -0.0614 | No |
| 18 | Il4ra | 9148 | 0.100 | -0.0596 | No |
| 19 | Socs3 | 9993 | 0.075 | -0.0864 | No |
| 20 | Il15ra | 10610 | 0.057 | -0.1058 | No |
| 21 | Stat3 | 10879 | 0.049 | -0.1130 | No |
| 22 | Il7 | 10901 | 0.049 | -0.1113 | No |
| 23 | Ptpn1 | 10902 | 0.049 | -0.1088 | No |
| 24 | Il1b | 11203 | 0.040 | -0.1176 | No |
| 25 | Tnfrsf1b | 12277 | 0.013 | -0.1559 | No |
| 26 | Ccr1 | 13755 | -0.017 | -0.2087 | No |
| 27 | Hmox1 | 13804 | -0.018 | -0.2095 | No |
| 28 | Pik3r5 | 14171 | -0.029 | -0.2213 | No |
| 29 | Lepr | 14431 | -0.036 | -0.2288 | No |
| 30 | Cd44 | 14507 | -0.039 | -0.2296 | No |
| 31 | Cxcl10 | 14687 | -0.044 | -0.2338 | No |
| 32 | Itga4 | 15188 | -0.058 | -0.2490 | No |
| 33 | Cbl | 15543 | -0.069 | -0.2583 | No |
| 34 | Myd88 | 15582 | -0.070 | -0.2561 | No |
| 35 | Ltb | 15967 | -0.081 | -0.2658 | No |
| 36 | Ptpn2 | 16090 | -0.084 | -0.2659 | No |
| 37 | Inhbe | 16560 | -0.098 | -0.2779 | No |
| 38 | Csf1 | 16754 | -0.104 | -0.2796 | No |
| 39 | Grb2 | 16829 | -0.106 | -0.2768 | No |
| 40 | Cd14 | 16942 | -0.110 | -0.2753 | No |
| 41 | Tyk2 | 17006 | -0.112 | -0.2718 | No |
| 42 | Irf1 | 18424 | -0.151 | -0.3155 | No |
| 43 | Pf4 | 18549 | -0.155 | -0.3120 | No |
| 44 | Il18r1 | 18723 | -0.161 | -0.3100 | No |
| 45 | Il17ra | 19572 | -0.191 | -0.3310 | No |
| 46 | Ltbr | 19868 | -0.202 | -0.3313 | No |
| 47 | Bak1 | 19915 | -0.204 | -0.3225 | No |
| 48 | Il12rb1 | 20445 | -0.218 | -0.3305 | No |
| 49 | Il10rb | 20841 | -0.230 | -0.3330 | No |
| 50 | Tnfrsf21 | 21284 | -0.247 | -0.3363 | Yes |
| 51 | Acvr1b | 21348 | -0.250 | -0.3258 | Yes |
| 52 | Stat2 | 21471 | -0.255 | -0.3171 | Yes |
| 53 | Map3k8 | 21568 | -0.259 | -0.3072 | Yes |
| 54 | Osmr | 21595 | -0.260 | -0.2948 | Yes |
| 55 | Csf3r | 21627 | -0.260 | -0.2825 | Yes |
| 56 | Cntfr | 21799 | -0.265 | -0.2751 | Yes |
| 57 | Il17rb | 21940 | -0.268 | -0.2663 | Yes |
| 58 | Pdgfc | 22074 | -0.274 | -0.2570 | Yes |
| 59 | Socs1 | 22513 | -0.293 | -0.2579 | Yes |
| 60 | Ifngr1 | 22541 | -0.294 | -0.2437 | Yes |
| 61 | Dntt | 22786 | -0.300 | -0.2371 | Yes |
| 62 | Il3ra | 23088 | -0.314 | -0.2319 | Yes |
| 63 | A2m | 23336 | -0.327 | -0.2240 | Yes |
| 64 | Tnfrsf1a | 23532 | -0.336 | -0.2138 | Yes |
| 65 | Cd9 | 24044 | -0.362 | -0.2137 | Yes |
| 66 | Il6st | 24097 | -0.366 | -0.1968 | Yes |
| 67 | Ifngr2 | 25182 | -0.424 | -0.2143 | Yes |
| 68 | Tgfb1 | 25418 | -0.440 | -0.2002 | Yes |
| 69 | Tnf | 25999 | -0.488 | -0.1962 | Yes |
| 70 | Tnfrsf12a | 26227 | -0.515 | -0.1779 | Yes |
| 71 | Crlf2 | 26228 | -0.515 | -0.1514 | Yes |
| 72 | Il2rg | 26230 | -0.515 | -0.1249 | Yes |
| 73 | Csf2ra | 26384 | -0.535 | -0.1029 | Yes |
| 74 | Il6 | 26547 | -0.562 | -0.0798 | Yes |
| 75 | Fas | 26888 | -0.621 | -0.0602 | Yes |
| 76 | Itgb3 | 27419 | -0.806 | -0.0379 | Yes |
| 77 | Il1r2 | 27484 | -0.865 | 0.0043 | Yes |