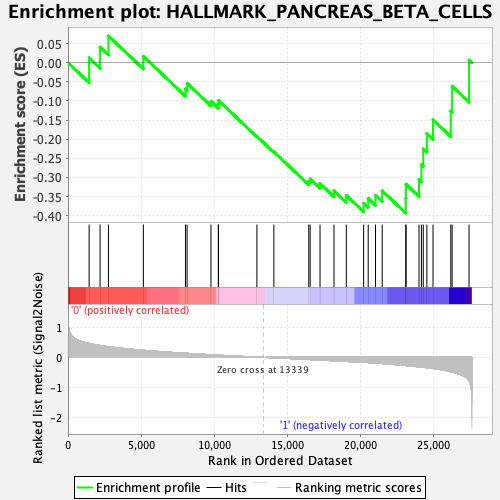
Profile of the Running ES Score & Positions of GeneSet Members on the Rank Ordered List
| Dataset | MEP.MEP.ery_Pheno.cls #Group1_versus_Group2.MEP.ery_Pheno.cls #Group1_versus_Group2_repos |
| Phenotype | MEP.ery_Pheno.cls#Group1_versus_Group2_repos |
| Upregulated in class | 1 |
| GeneSet | HALLMARK_PANCREAS_BETA_CELLS |
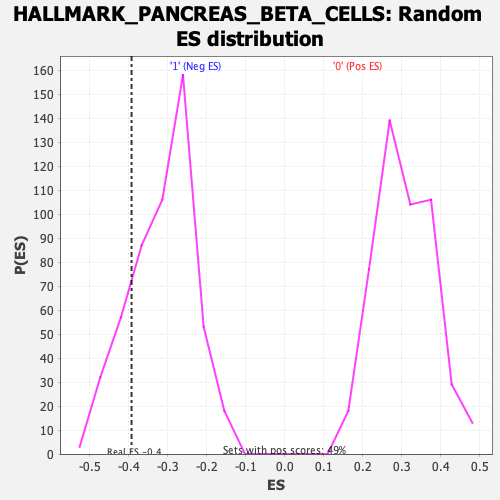
| Enrichment Score (ES) | -0.39322004 |
| Normalized Enrichment Score (NES) | -1.2556353 |
| Nominal p-value | 0.17898832 |
| FDR q-value | 0.8857491 |
| FWER p-Value | 0.83 |
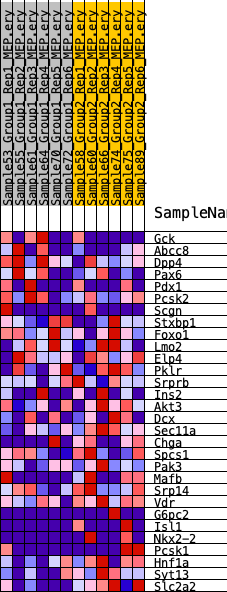
| SYMBOL | RANK IN GENE LIST | RANK METRIC SCORE | RUNNING ES | CORE ENRICHMENT | |
|---|---|---|---|---|---|
| 1 | Gck | 1445 | 0.461 | 0.0127 | No |
| 2 | Abcc8 | 2193 | 0.392 | 0.0409 | No |
| 3 | Dpp4 | 2765 | 0.354 | 0.0701 | No |
| 4 | Pax6 | 5152 | 0.234 | 0.0166 | No |
| 5 | Pdx1 | 8029 | 0.136 | -0.0685 | No |
| 6 | Pcsk2 | 8140 | 0.133 | -0.0537 | No |
| 7 | Scgn | 9773 | 0.086 | -0.1007 | No |
| 8 | Stxbp1 | 10275 | 0.073 | -0.1086 | No |
| 9 | Foxo1 | 10287 | 0.073 | -0.0987 | No |
| 10 | Lmo2 | 12912 | 0.010 | -0.1925 | No |
| 11 | Elp4 | 14072 | -0.012 | -0.2328 | No |
| 12 | Pklr | 16457 | -0.067 | -0.3099 | No |
| 13 | Srprb | 16554 | -0.069 | -0.3036 | No |
| 14 | Ins2 | 17227 | -0.085 | -0.3159 | No |
| 15 | Akt3 | 18182 | -0.109 | -0.3351 | No |
| 16 | Dcx | 19024 | -0.131 | -0.3470 | No |
| 17 | Sec11a | 20209 | -0.161 | -0.3672 | Yes |
| 18 | Chga | 20520 | -0.169 | -0.3546 | Yes |
| 19 | Spcs1 | 21020 | -0.185 | -0.3466 | Yes |
| 20 | Pak3 | 21477 | -0.201 | -0.3348 | Yes |
| 21 | Mafb | 23090 | -0.269 | -0.3552 | Yes |
| 22 | Srp14 | 23105 | -0.270 | -0.3176 | Yes |
| 23 | Vdr | 23993 | -0.314 | -0.3055 | Yes |
| 24 | G6pc2 | 24157 | -0.321 | -0.2660 | Yes |
| 25 | Isl1 | 24284 | -0.326 | -0.2246 | Yes |
| 26 | Nkx2-2 | 24530 | -0.340 | -0.1854 | Yes |
| 27 | Pcsk1 | 24951 | -0.364 | -0.1492 | Yes |
| 28 | Hnf1a | 26164 | -0.474 | -0.1262 | Yes |
| 29 | Syt13 | 26257 | -0.484 | -0.0612 | Yes |
| 30 | Slc2a2 | 27412 | -0.779 | 0.0069 | Yes |