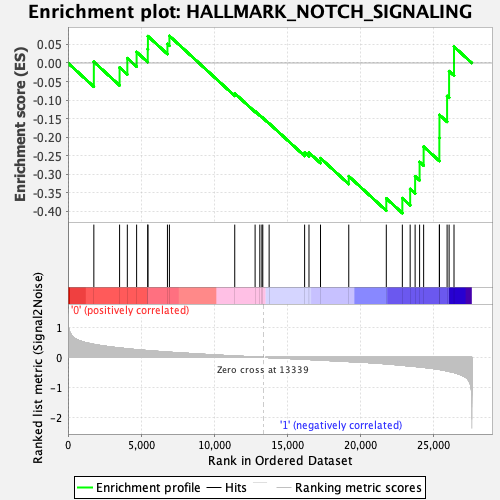
Profile of the Running ES Score & Positions of GeneSet Members on the Rank Ordered List
| Dataset | MEP.MEP.ery_Pheno.cls #Group1_versus_Group2.MEP.ery_Pheno.cls #Group1_versus_Group2_repos |
| Phenotype | MEP.ery_Pheno.cls#Group1_versus_Group2_repos |
| Upregulated in class | 1 |
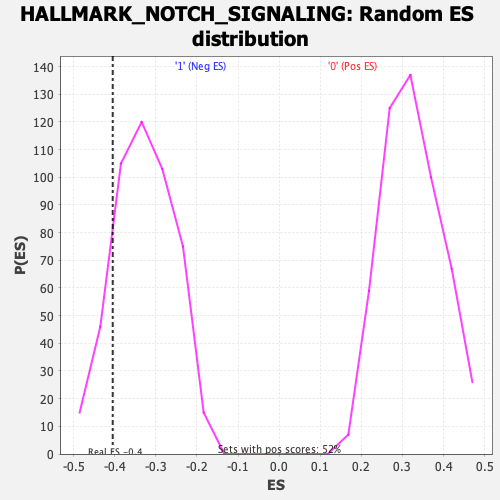
| GeneSet | HALLMARK_NOTCH_SIGNALING |
| Enrichment Score (ES) | -0.40493414 |
| Normalized Enrichment Score (NES) | -1.2341975 |
| Nominal p-value | 0.13152401 |
| FDR q-value | 0.8447295 |
| FWER p-Value | 0.856 |
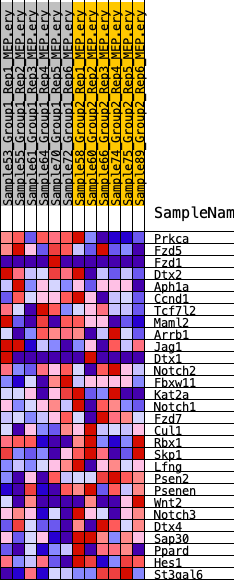
| SYMBOL | RANK IN GENE LIST | RANK METRIC SCORE | RUNNING ES | CORE ENRICHMENT | |
|---|---|---|---|---|---|
| 1 | Prkca | 1766 | 0.428 | 0.0032 | No |
| 2 | Fzd5 | 3526 | 0.309 | -0.0121 | No |
| 3 | Fzd1 | 4055 | 0.281 | 0.0130 | No |
| 4 | Dtx2 | 4690 | 0.253 | 0.0298 | No |
| 5 | Aph1a | 5451 | 0.225 | 0.0375 | No |
| 6 | Ccnd1 | 5463 | 0.224 | 0.0724 | No |
| 7 | Tcf7l2 | 6797 | 0.174 | 0.0513 | No |
| 8 | Maml2 | 6932 | 0.170 | 0.0732 | No |
| 9 | Arrb1 | 11397 | 0.044 | -0.0818 | No |
| 10 | Jag1 | 12789 | 0.013 | -0.1302 | No |
| 11 | Dtx1 | 13112 | 0.005 | -0.1411 | No |
| 12 | Notch2 | 13253 | 0.002 | -0.1459 | No |
| 13 | Fbxw11 | 13315 | 0.001 | -0.1480 | No |
| 14 | Kat2a | 13748 | -0.005 | -0.1628 | No |
| 15 | Notch1 | 16174 | -0.060 | -0.2414 | No |
| 16 | Fzd7 | 16472 | -0.067 | -0.2416 | No |
| 17 | Cul1 | 17260 | -0.086 | -0.2566 | No |
| 18 | Rbx1 | 19191 | -0.136 | -0.3053 | No |
| 19 | Skp1 | 21757 | -0.211 | -0.3652 | Yes |
| 20 | Lfng | 22854 | -0.258 | -0.3644 | Yes |
| 21 | Psen2 | 23388 | -0.280 | -0.3397 | Yes |
| 22 | Psenen | 23727 | -0.297 | -0.3054 | Yes |
| 23 | Wnt2 | 24033 | -0.316 | -0.2668 | Yes |
| 24 | Notch3 | 24309 | -0.327 | -0.2255 | Yes |
| 25 | Dtx4 | 25383 | -0.397 | -0.2021 | Yes |
| 26 | Sap30 | 25391 | -0.397 | -0.1399 | Yes |
| 27 | Ppard | 25913 | -0.444 | -0.0890 | Yes |
| 28 | Hes1 | 26050 | -0.458 | -0.0220 | Yes |
| 29 | St3gal6 | 26385 | -0.498 | 0.0441 | Yes |