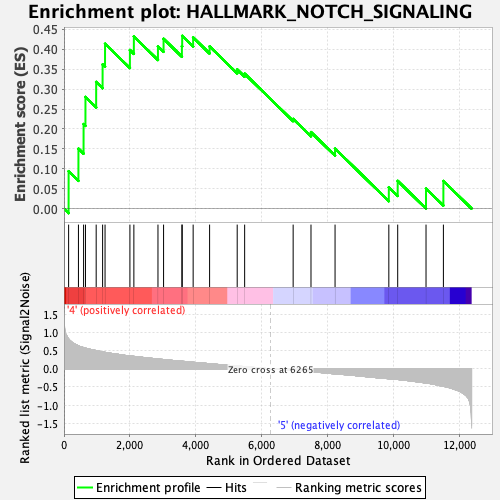
Profile of the Running ES Score & Positions of GeneSet Members on the Rank Ordered List
| Dataset | HSC.HSC_Pheno.cls#Group6_versus_Group8.HSC_Pheno.cls#Group6_versus_Group8_repos |
| Phenotype | HSC_Pheno.cls#Group6_versus_Group8_repos |
| Upregulated in class | 4 |
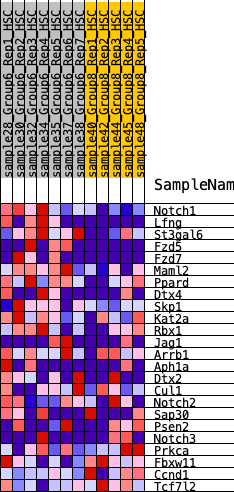
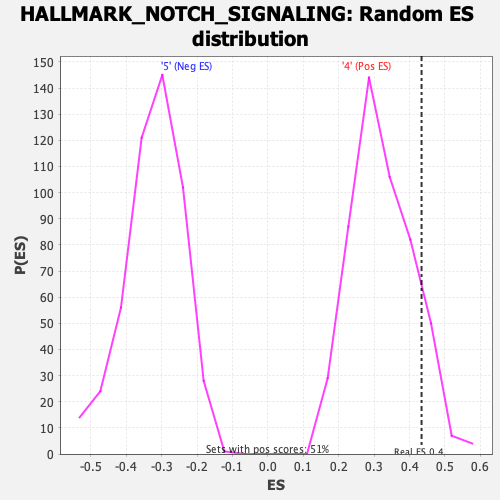
| GeneSet | HALLMARK_NOTCH_SIGNALING |
| Enrichment Score (ES) | 0.4338281 |
| Normalized Enrichment Score (NES) | 1.3462896 |
| Nominal p-value | 0.11198428 |
| FDR q-value | 1.0 |
| FWER p-Value | 0.65 |
| SYMBOL | RANK IN GENE LIST | RANK METRIC SCORE | RUNNING ES | CORE ENRICHMENT | |
|---|---|---|---|---|---|
| 1 | Notch1 | 140 | 0.820 | 0.0938 | Yes |
| 2 | Lfng | 438 | 0.629 | 0.1505 | Yes |
| 3 | St3gal6 | 594 | 0.579 | 0.2123 | Yes |
| 4 | Fzd5 | 651 | 0.566 | 0.2804 | Yes |
| 5 | Fzd7 | 976 | 0.498 | 0.3181 | Yes |
| 6 | Maml2 | 1171 | 0.465 | 0.3621 | Yes |
| 7 | Ppard | 1245 | 0.451 | 0.4140 | Yes |
| 8 | Dtx4 | 1999 | 0.353 | 0.3983 | Yes |
| 9 | Skp1 | 2119 | 0.340 | 0.4323 | Yes |
| 10 | Kat2a | 2850 | 0.268 | 0.4075 | Yes |
| 11 | Rbx1 | 3020 | 0.254 | 0.4265 | Yes |
| 12 | Jag1 | 3576 | 0.207 | 0.4080 | Yes |
| 13 | Arrb1 | 3585 | 0.206 | 0.4338 | Yes |
| 14 | Aph1a | 3917 | 0.178 | 0.4299 | No |
| 15 | Dtx2 | 4416 | 0.139 | 0.4074 | No |
| 16 | Cul1 | 5253 | 0.077 | 0.3495 | No |
| 17 | Notch2 | 5479 | 0.058 | 0.3388 | No |
| 18 | Sap30 | 6950 | -0.043 | 0.2252 | No |
| 19 | Psen2 | 7491 | -0.083 | 0.1921 | No |
| 20 | Notch3 | 8221 | -0.138 | 0.1507 | No |
| 21 | Prkca | 9852 | -0.272 | 0.0536 | No |
| 22 | Fbxw11 | 10121 | -0.294 | 0.0696 | No |
| 23 | Ccnd1 | 10980 | -0.392 | 0.0503 | No |
| 24 | Tcf7l2 | 11507 | -0.481 | 0.0694 | No |